What's new in 4.16.0

July 30, 2026 in Releases by David Wiseman3 minutes

What's new in 4.16.0

OS-level Perfmon counter collection, improved Metrics tab and charting options.

Overview

DBA Dash 4.16.0 adds native OS Perfmon counter collection and several usability improvements to the Metrics tab, charting, and alert rules. This release expands host-level visibility, simplifies multi-metric charts, and introduces a more flexible CustomSql alert type. The sections below summarize the highlights and show quick configuration and upgrade notes.

OS-level (Perfmon) counter collection

Previously DBA Dash collected a subset of Windows performance counters via the sys.dm_os_performance_counters DMV. Version 4.16.0 can also capture native OS Perfmon counters, exposing many additional host-level metrics.

Where to find them:
  • Counters appear on the Metrics tab alongside DMV-collected metrics.
  • Counters can be added to dashboards, included in custom reports, and used for alerts.

Why this matters

  • Gain host-level metrics (CPU queue lengths, disk/adapter counters, NIC stats, etc.) alongside DMV-derived SQL Server metrics.
  • Useful for troubleshooting OS-level bottlenecks that don’t appear in SQL DMVs.

Configuration (quick)

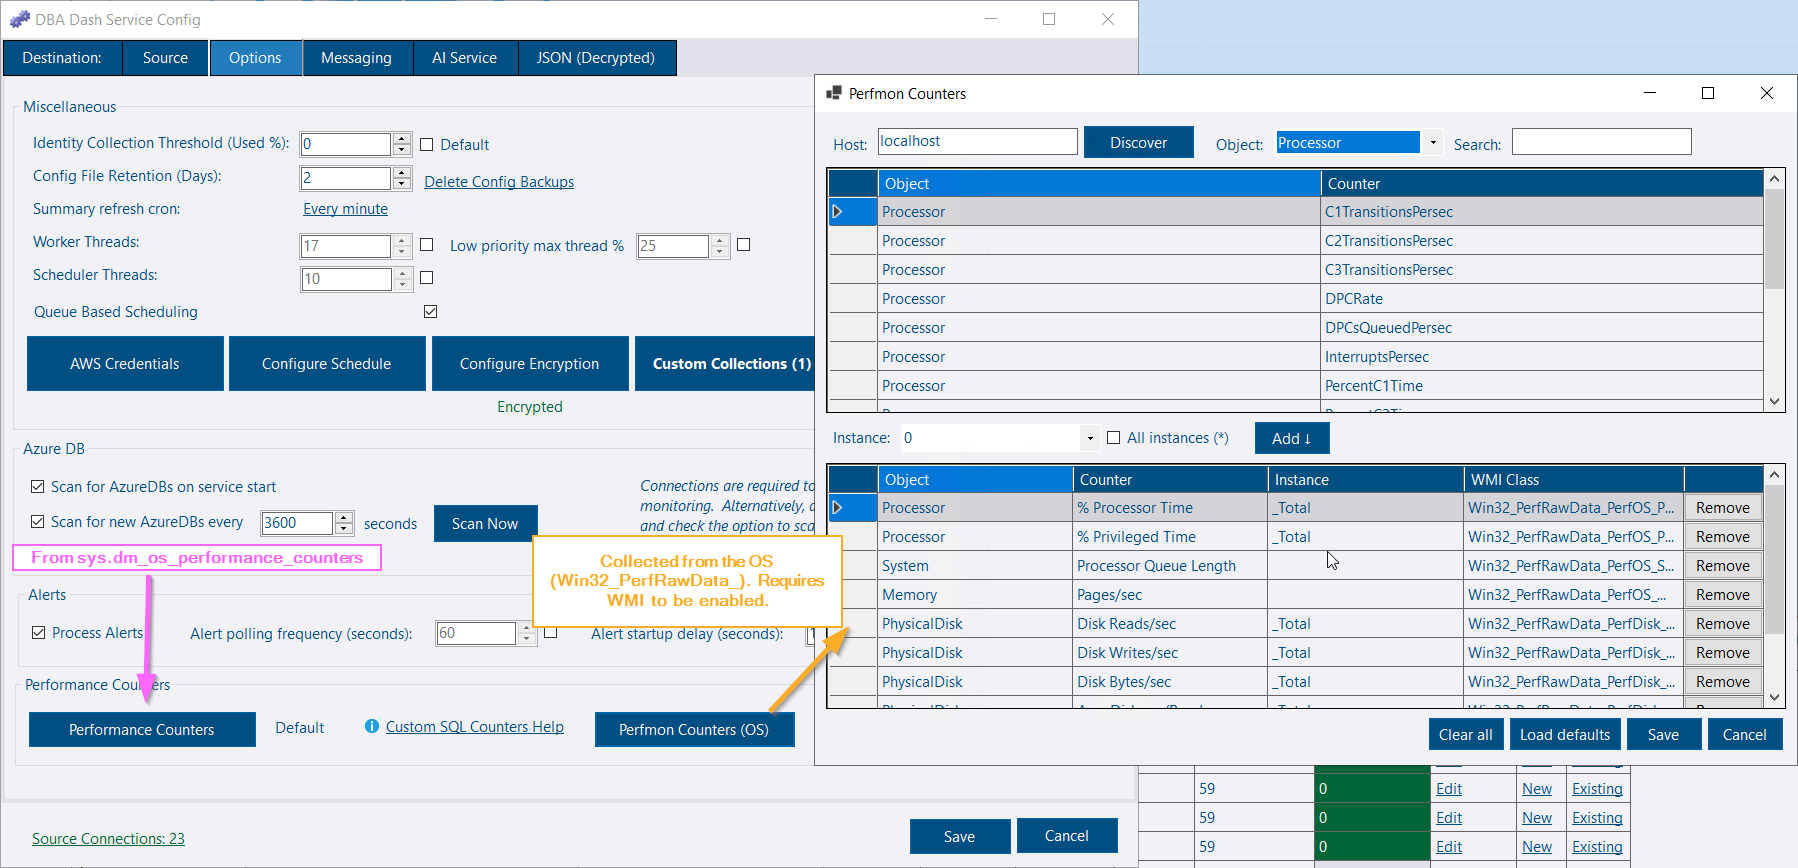
Perfmon counter configuration

  1. Open the service configuration tool β†’ Options β†’ Perfmon Counters (OS).
  2. (Optional) Click Load Defaults for a curated starter set.
  3. Enter a host name and click Discover to list counters.
  4. Use the object filter/search, select counters, click Add, then Save.

Notes:

  • Selected counters apply to all instances that have WMI enabled. You can override this per-instance if required.

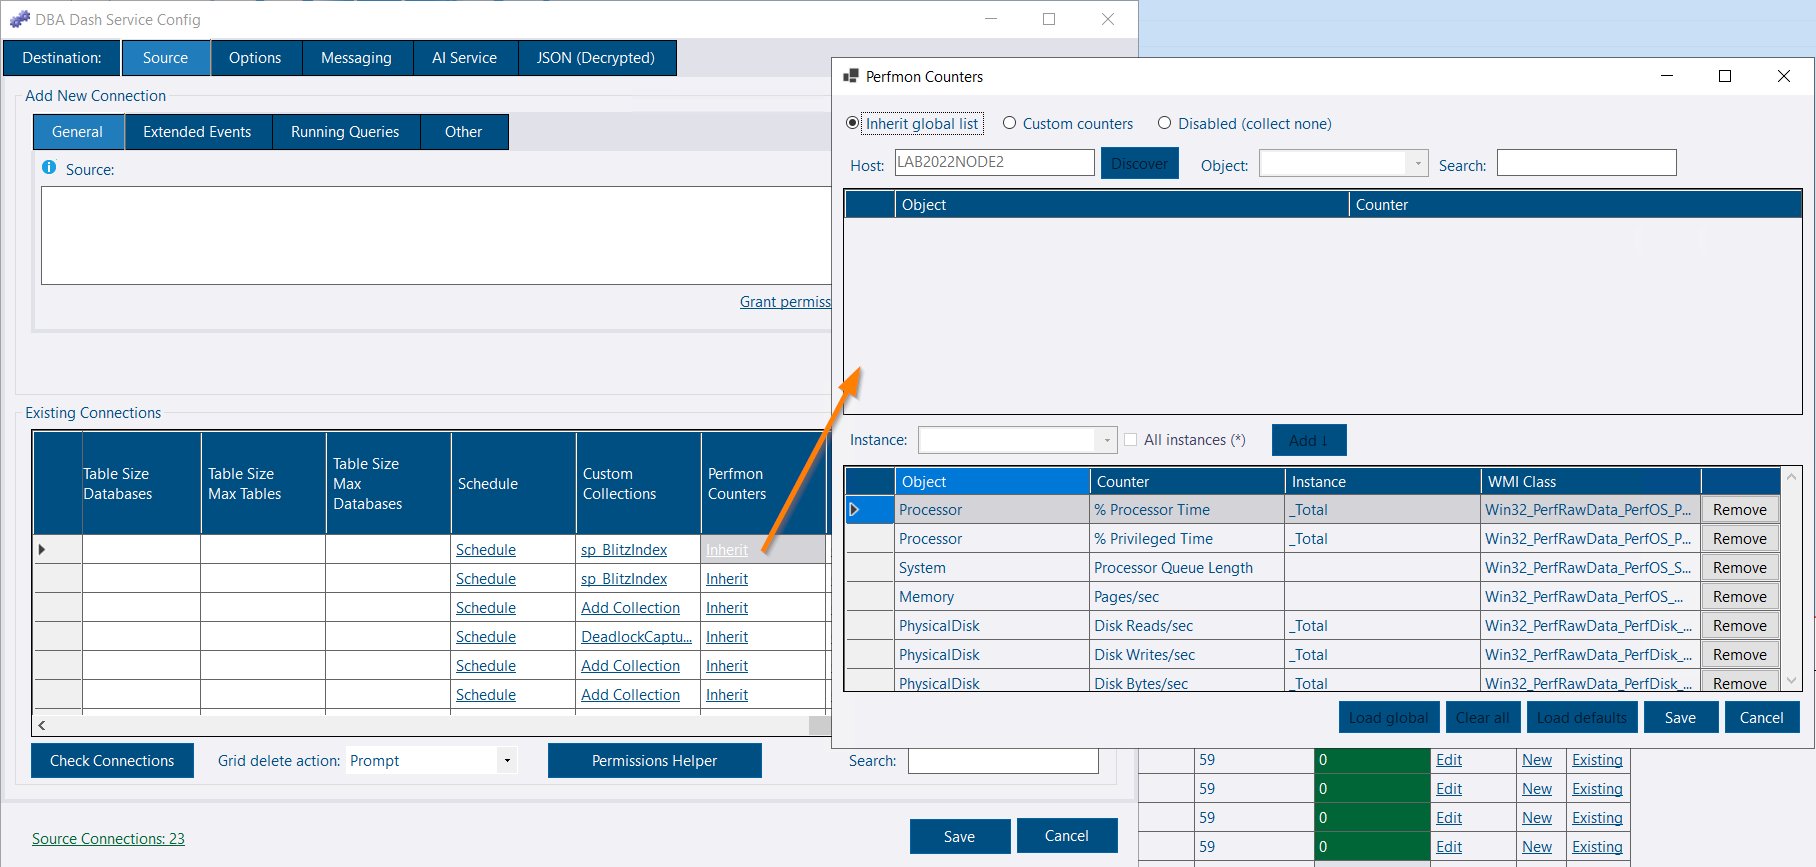
To override counters per instance:

Instance Perfmon counter configuration

  1. In the Source tab, open the Perfmon Counters configuration for the instance.
  2. Choose Inherit global list, Custom counters (optionally Load Global to import), or Disabled (collect none).
  3. Modify the list and click Save.

Metrics tab and charting improvements

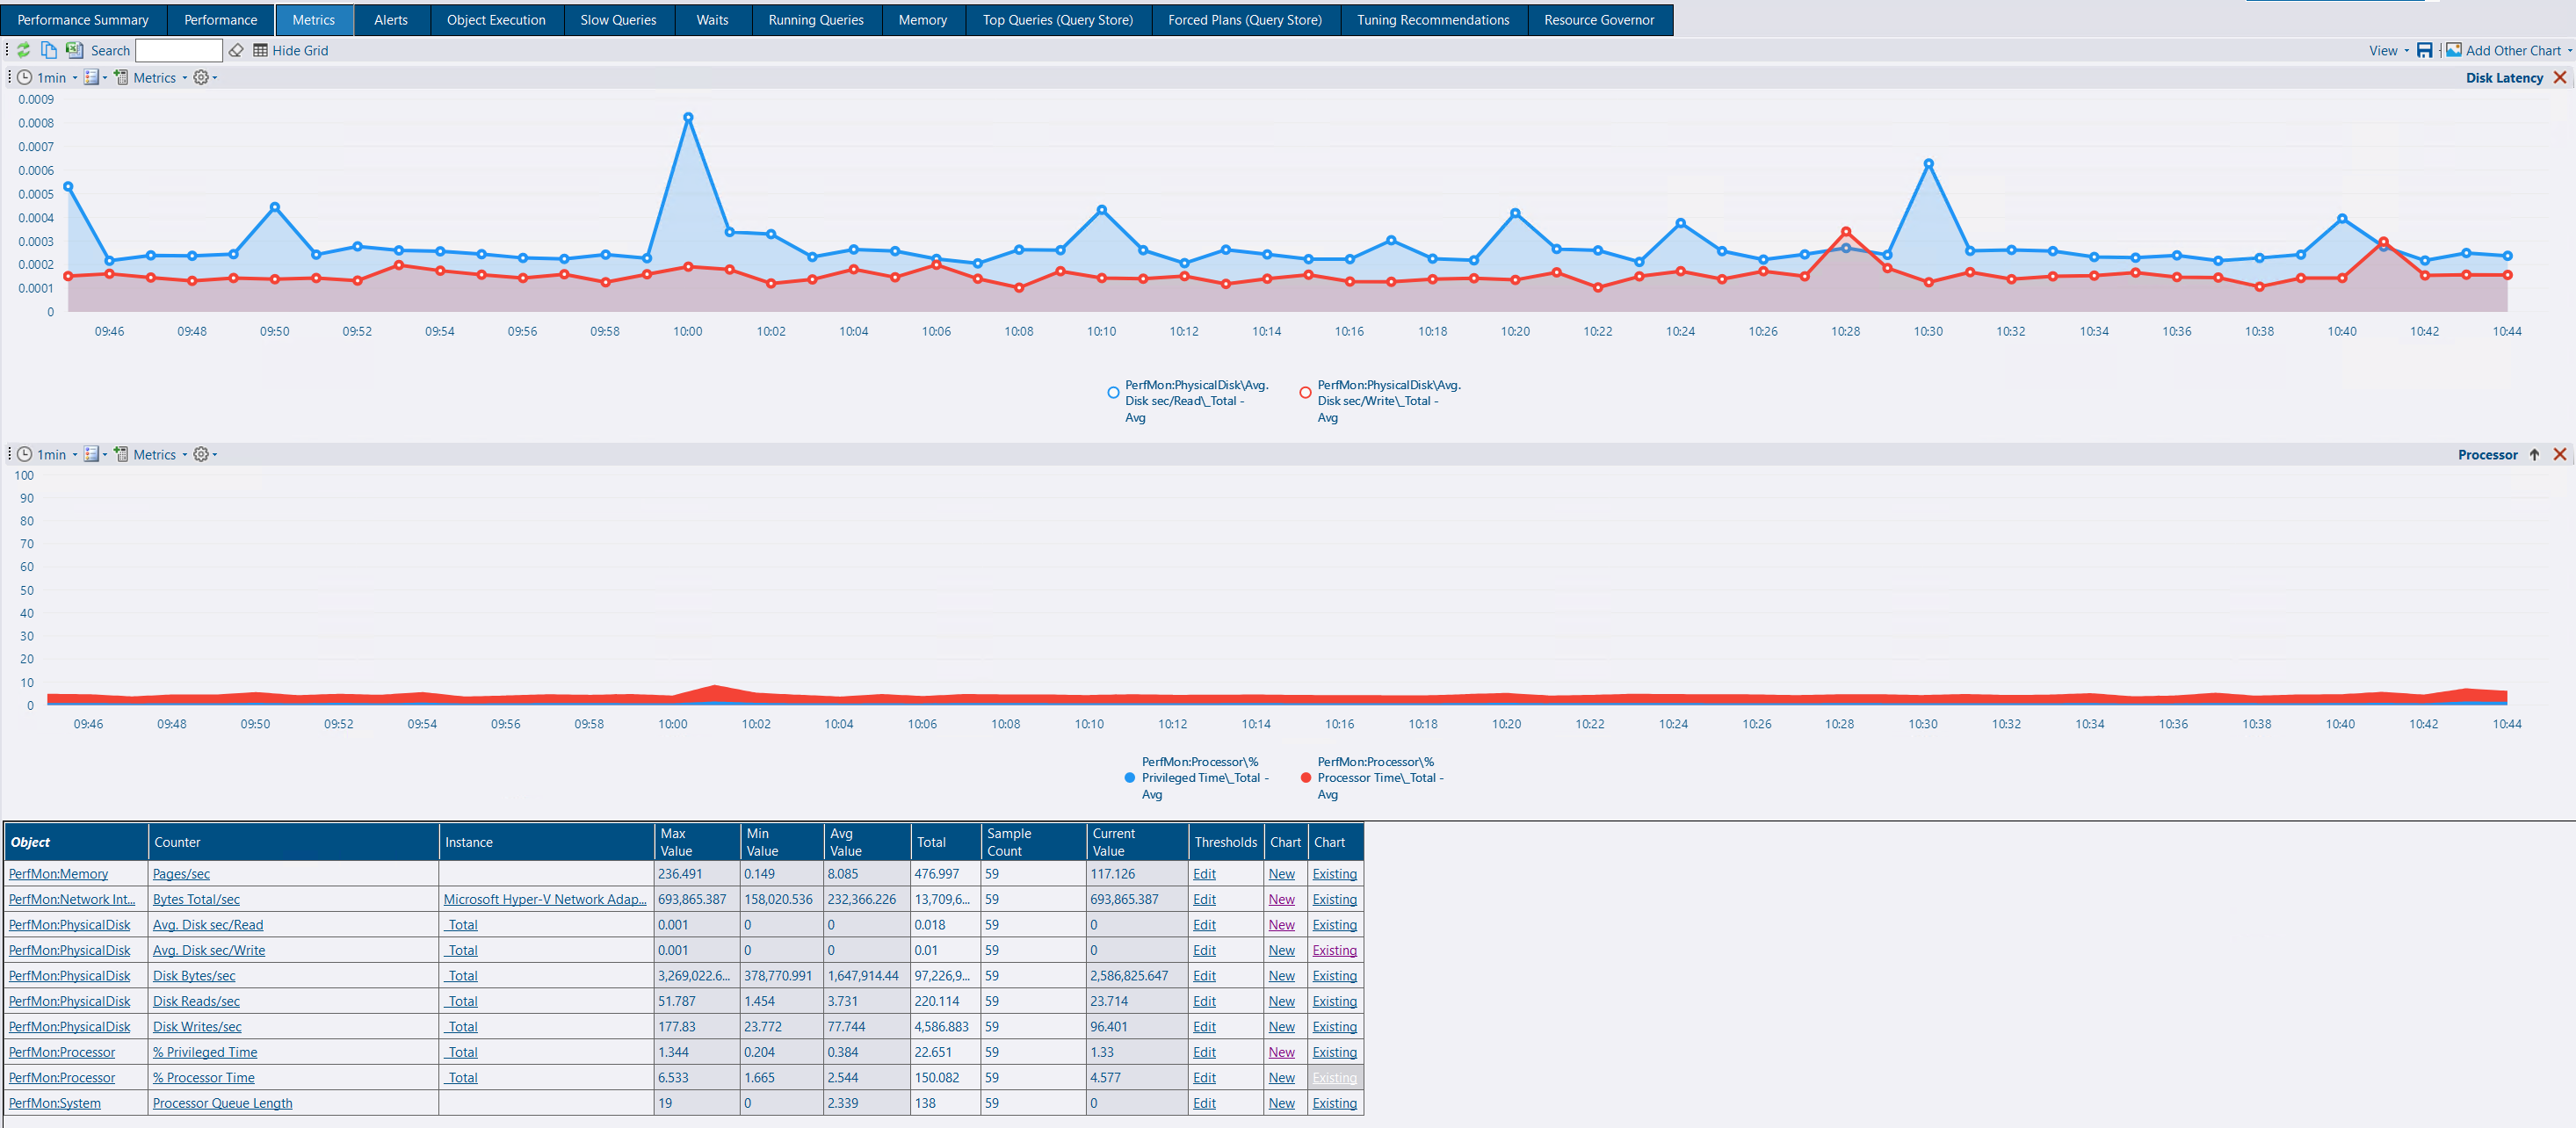
Metrics tab showing the New and Existing actions and charting options.

You can now combine multiple metrics into a single chart and configure aggregation, axes, and chart types more easily:

  • New β€” create a new chart for the selected metric.
  • Existing β€” add the selected metric to the most recently used chart; if no chart exists, a new one will be created.

Use cases:

  • Combine related metrics (for example, Avg. Disk sec/Read and Avg. Disk sec/Write) into a single Disk Latency chart.
  • Overlay OS-level counters with DMV metrics to correlate SQL activity with host behavior.

Tip:

  • Use the Metrics toolbar to add metrics and choose aggregation (avg, max, sum) appropriate to the metric.

Alert Improvements

CustomSql alert type

The CustomSql alert type lets you implement bespoke alerting logic using a stored procedure in the UserAlert schema. The proc must return three columns:

  • InstanceID INT β€” the instance the alert relates to
  • AlertKey NVARCHAR(256) β€” unique key per item within the instance (used for de-dupe/resolution)
  • AlertMessage NVARCHAR(MAX) β€” the alert message

See the example template: UserAlert.DatabaseCorruptionExample.
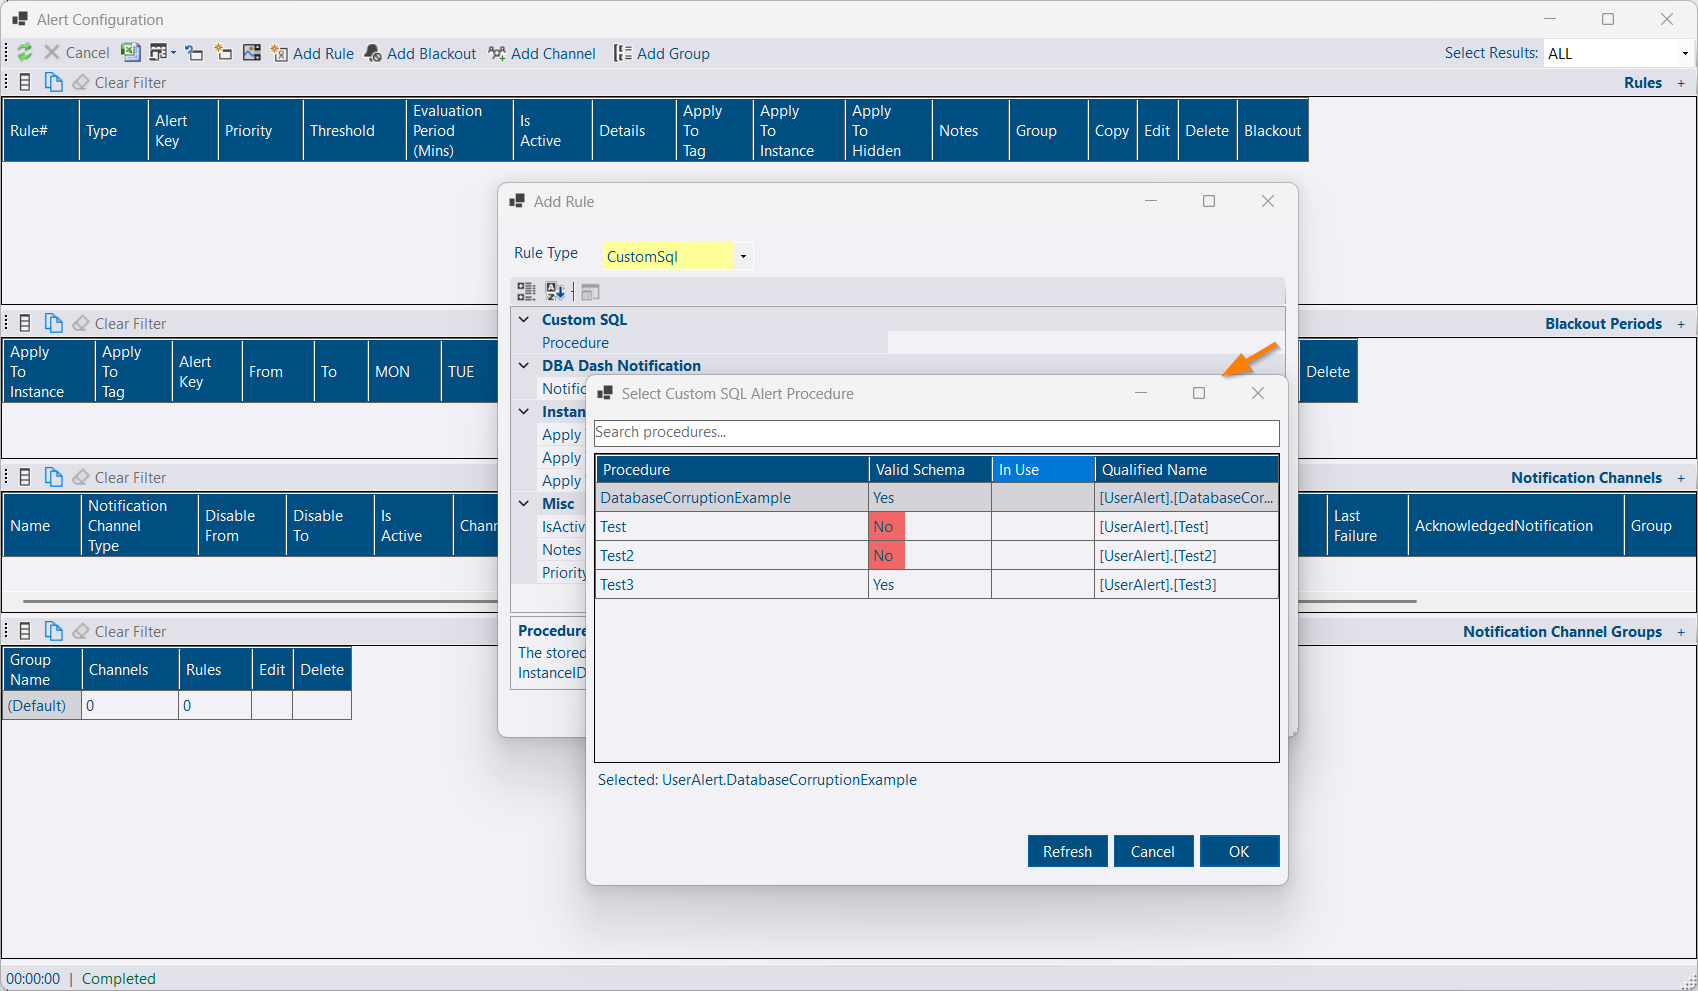
CustomSql Alert type

If the stored procedure uses the correct schema and columns it will show as valid in the UI.

Other new rules

  • FailedLogins β€” alert on a specified threshold of failed logins over a time window.
  • DatabaseMail β€” alert when Database Mail stops or is misconfigured.

Agent Job exclusions for daily checks

Agent jobs can now be excluded from daily checks (summary/job status pages) by name, category, or description. Exclusions may be configured globally or per-instance.
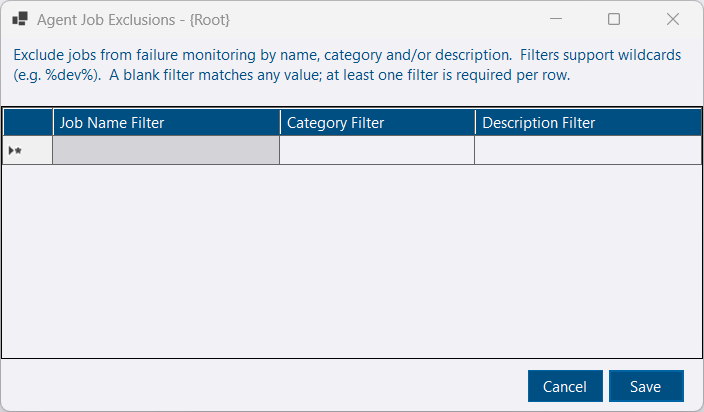
Agent job exclusions dialog

Other improvements

See the 4.16.0 release notes for a full list of fixes and improvements.

Note: There was no blog post for 4.15 (it was a maintenance release). See the fixes for 4.15 here.