Title here
Summary here
August 28, 2026 in Releases by David Wiseman3 minutes

Ad‑hoc XE sessions, Running Queries improvements, and usability updates.
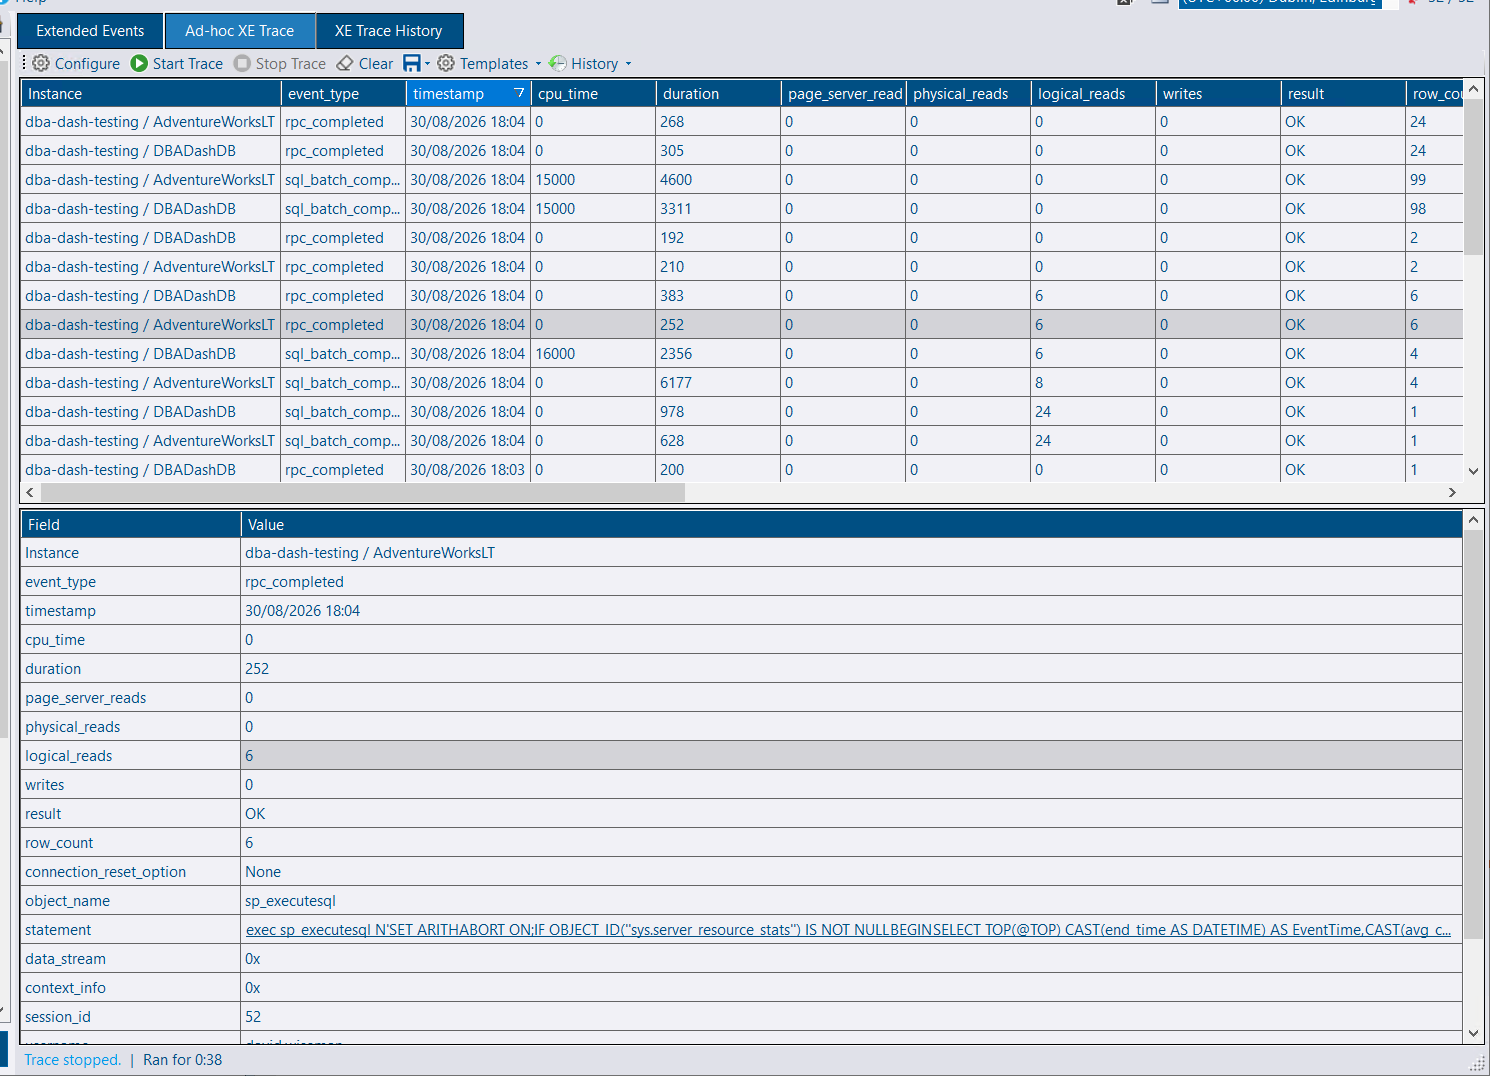
You can now create ad-hoc Extended Events (XE) sessions directly from DBA Dash. This avoids switching tools when you need a short-lived trace and adds functionality for tracing across multiple instances.
Multi-instance tracing: trace across Availability Group nodes (primary + replicas) or multiple Azure databases and view a combined result set.
Simplified configuration: a responsive UI makes it easier to pick events, fields, and filters.
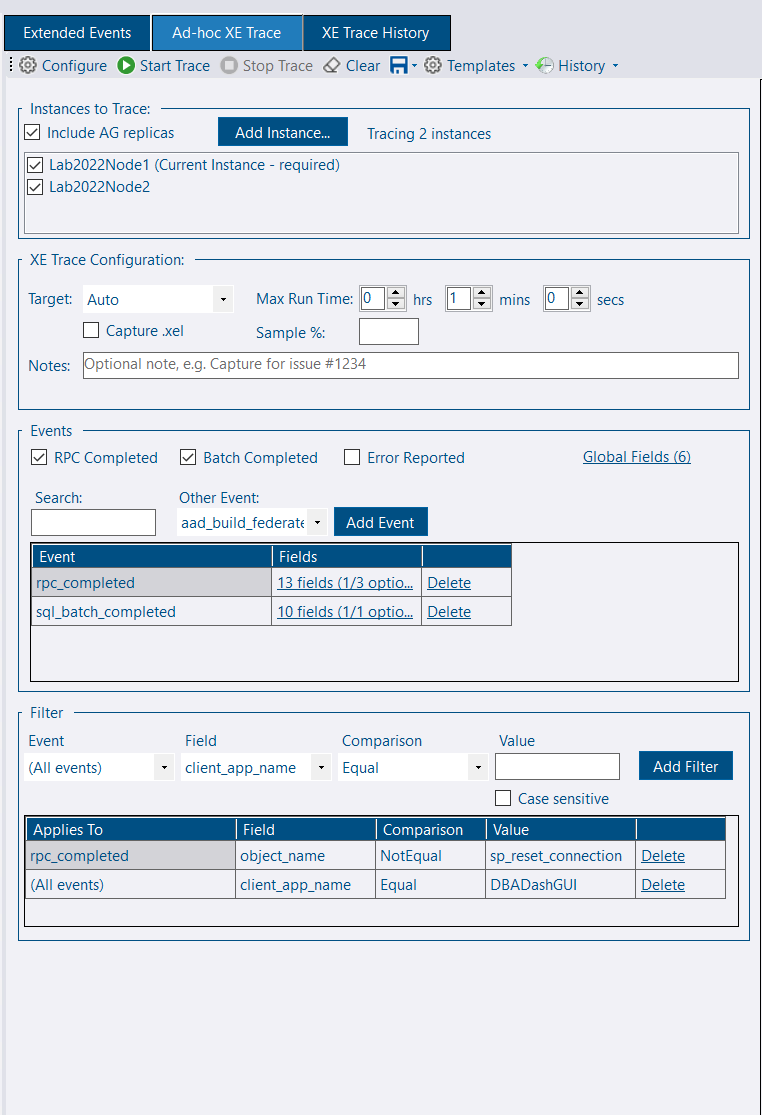
Save/load templates: persist trace configurations (events, fields, filters) and reload them later; templates can prompt for values (for example, application name or session_id).
History and retention: trace runs are recorded in the repository database so you can reload runs, add notes, export results, or remove traces. Retention is configurable.
Time limits: client-side durations are supported and traces stop automatically when the configured time elapses.
Flexible results grid: group, filter, and aggregate results using the DBA Dash grid — choose multiple groupings and aggregations per column.
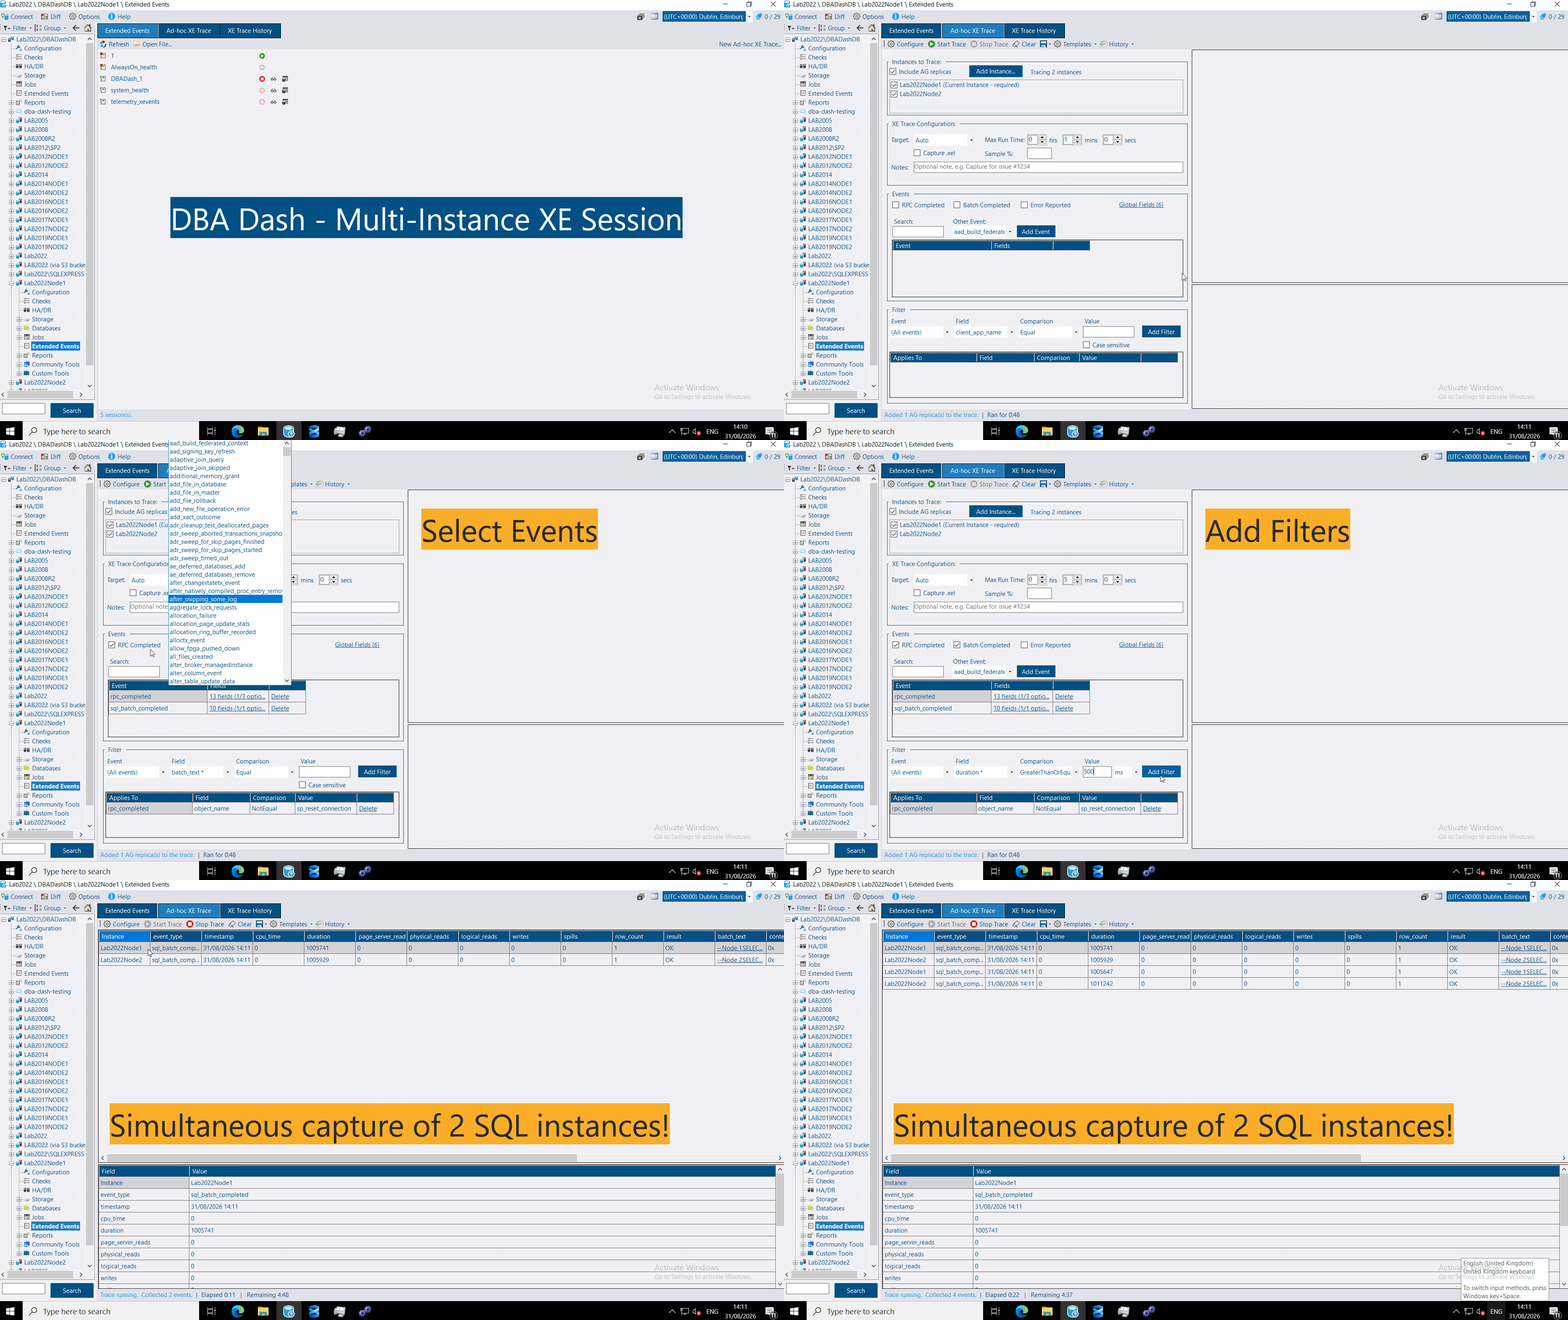
DBA Dash also discovers and manages existing XE sessions across your estate. Features include:
CREATE EVENT SESSION scriptEnable Extended Events in the Service Configuration tool (Messaging tab). See the Extended Events guide for configuration and repository security details: /docs/help/extended-events.
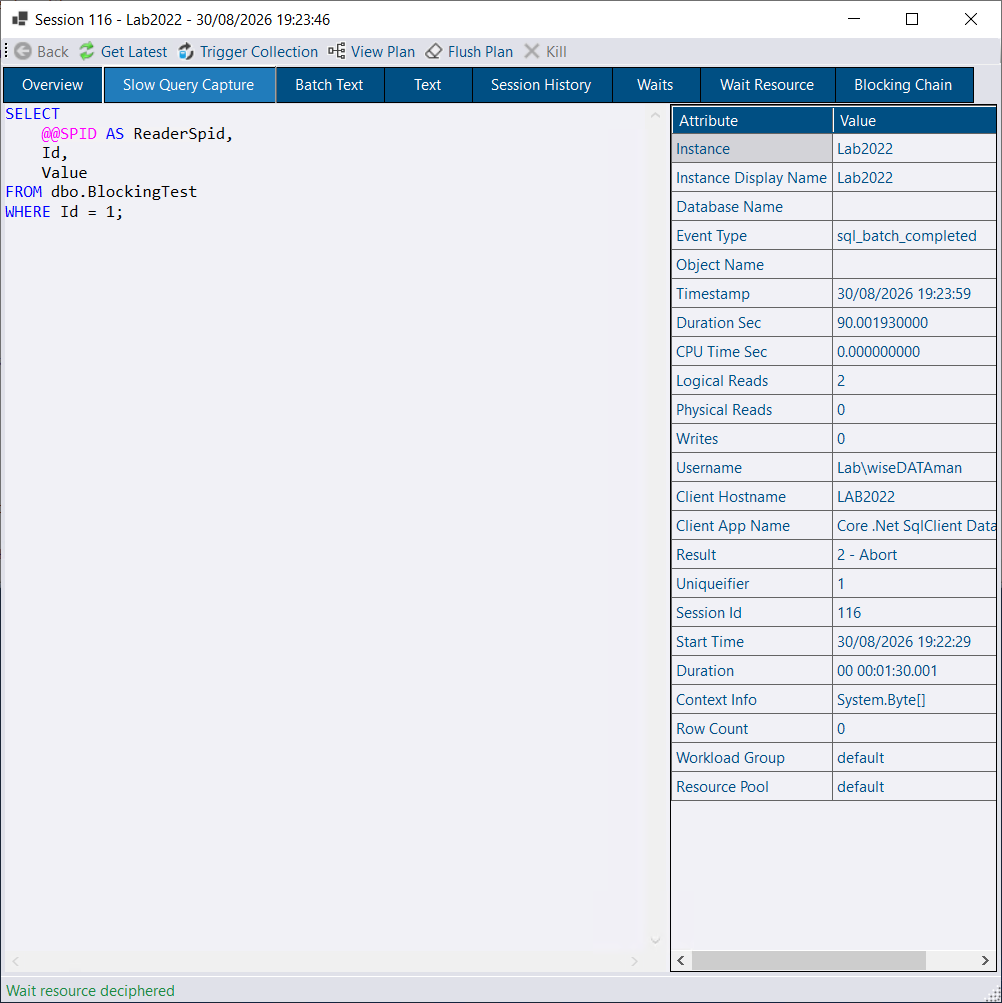
Previously, clicking the Session ID column on the Running Queries tab opened the associated rpc_completed/sql_batch_completed event (when available), showing the query as submitted from the client with parameters and execution metrics. That functionality remains, but the dialog now opens to an Overview tab by default — a pivoted, easier-to-read summary of Running Queries data — and surfaces helpful information cards.
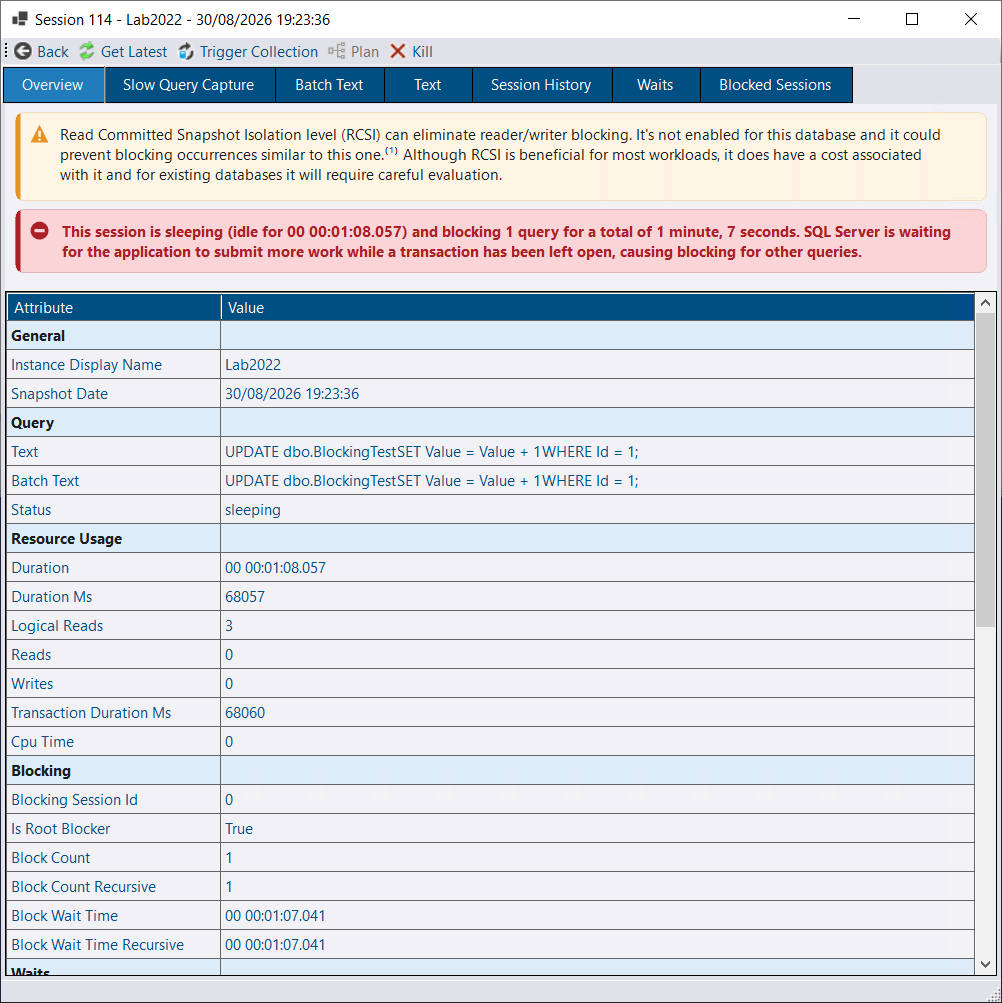
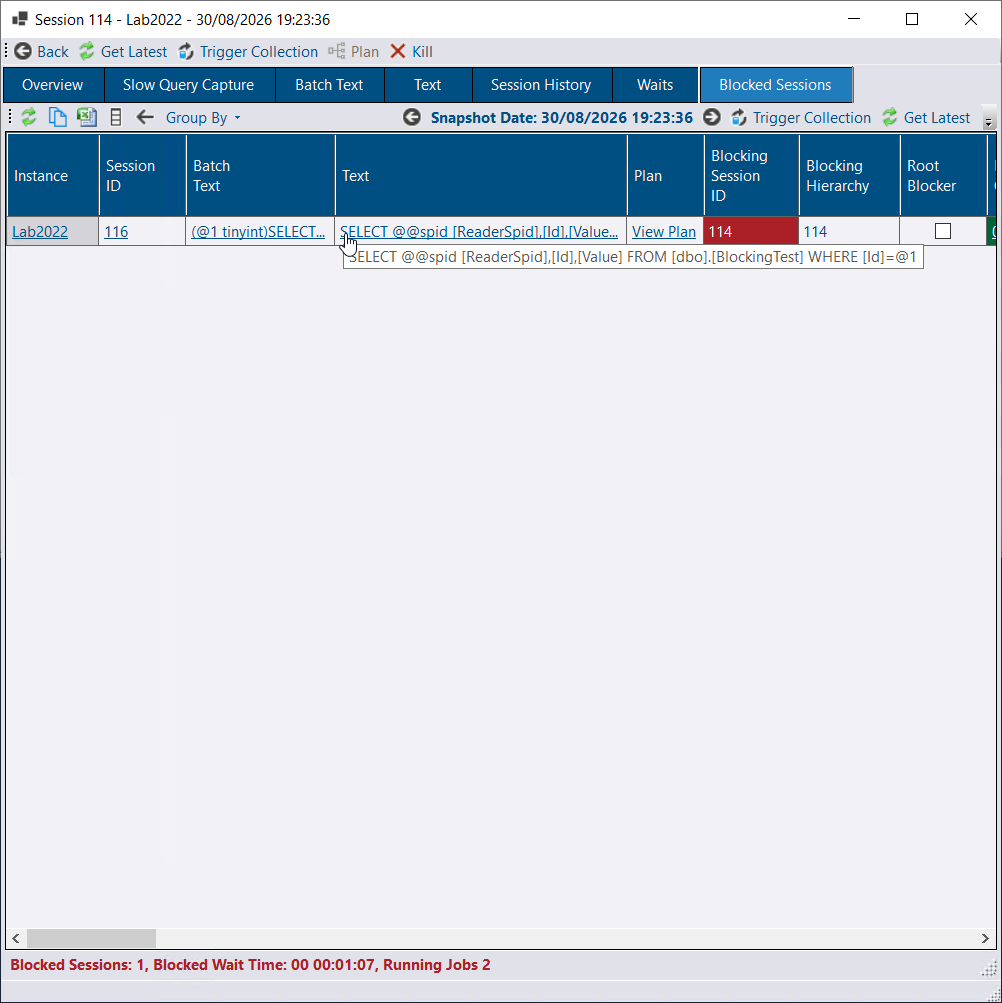
The red information card above highlights a session that has been idle for more than a minute (waiting for the application to commit or send more work). The yellow information card highlights that blocking that could be mitigated under RCSI. On the Blocked Sessions tab you can jump to the blocked request and inspect details.
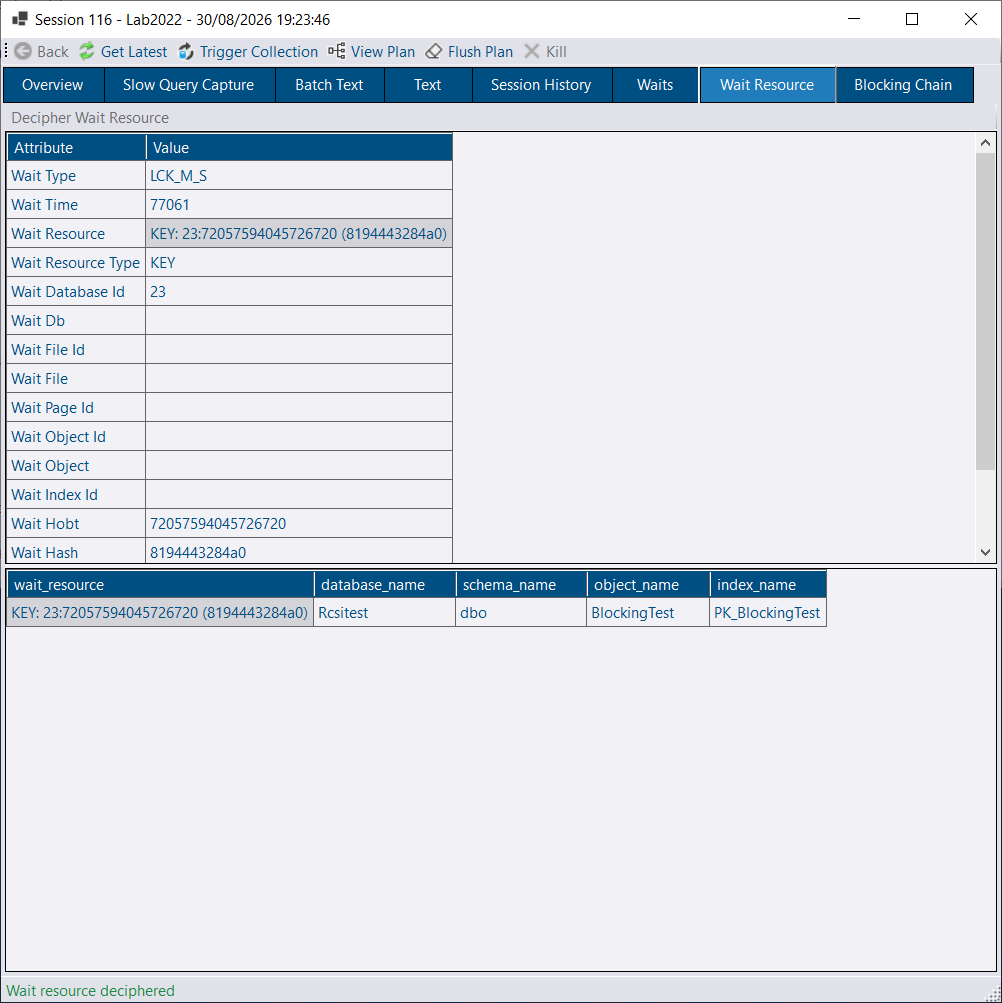
The “Wait Resource” tab includes a “Decipher Wait Resource” action that translates wait strings like “KEY: 23:72057594045726720 (8194443284a0)” into a human-readable form; the data is collected and returned automatically via the messaging feature.
There are many features in this dialog: session waits, session history, Query Store, query plan, and the sql_batch_completed/rpc_completed event details remain available.
Actions available (when enabled in the Messaging tab and when the user has the required repository DB role membership such as AllowKillSession or AllowPlanForcing):
DBCC FREEPROCCACHE with the plan handle. This helps recover from parameter-sniffing problems; if Query Store is available consider forcing a plan from the Query Store tab instead.See the 4.17.0 release notes for a full list of fixes and improvements.