Title here
Summary here
September 14, 2026 in Releases by David Wiseman5 minutes

Native deadlock monitoring and analysis, plus Azure SQL read replica support.
DBA Dash 4.18.0 adds native deadlock monitoring from collection through analysis and visualization, including a dedicated deadlock viewer and optional AI analysis. This release also makes it easier to monitor Azure SQL Database read replicas.
DBA Dash previously had limited support for deadlocks. It captured the Locks\Number of Deadlocks/sec\_Total performance counter, which was available on the Metrics tab and used to calculate a deadlock count on the Performance tab. Clicking a deadlock square on the Performance tab ran sp_BlitzLock for that time period, providing information about the associated deadlocks, including a deadlock graph that could be opened in SSMS.
DBA Dash now has comprehensive support for deadlocks, including:
query_hash by identifying similar deadlock eventssp_BlitzLock is no longer required (although it remains available).xdl files saved from SSMS or elsewhere in the new viewerDeadlock collection is scheduled to run every 5 minutes by default, but nothing is collected until a capture option is configured for each monitored instance. SQL Server, Amazon RDS, Azure SQL Managed Instance, and Azure SQL Database are all supported.
See the Deadlocks documentation for the full detail - permissions, service level settings, how the collection works, and troubleshooting.
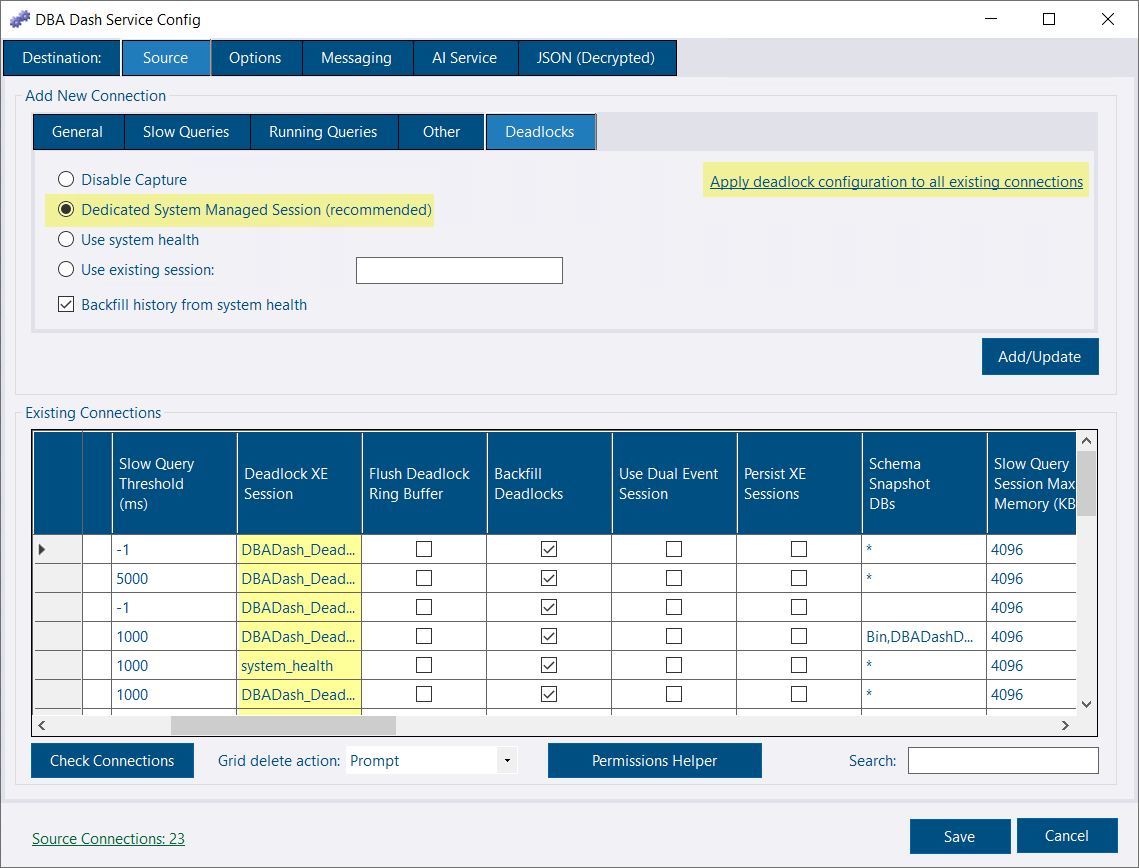
system_health session already captures deadlocks, but it contains other events that must be processed. This is less efficient than using a dedicated session.sqlserver.xml_deadlock_report event. Ideally, the session should only include this event.If you choose the system-managed session, a new XE session named DBADash_Deadlocks is created on the instance and captures deadlocks from that point forward. This requires the ALTER ANY EVENT SESSION permission, which slow query capture already uses. You can also backfill historical deadlocks from system_health. This runs once in the background after the first collection.
Deadlock XE Session column in the existing connections grid to DBADash_Deadlocks (recommended), system_health, or your own custom session name.system_health is enabled by default. Uncheck this option if you do not want to capture historical data.Alternatively, click the Deadlocks tab, select the option you want to use, and click Apply deadlock configuration to all existing connections.
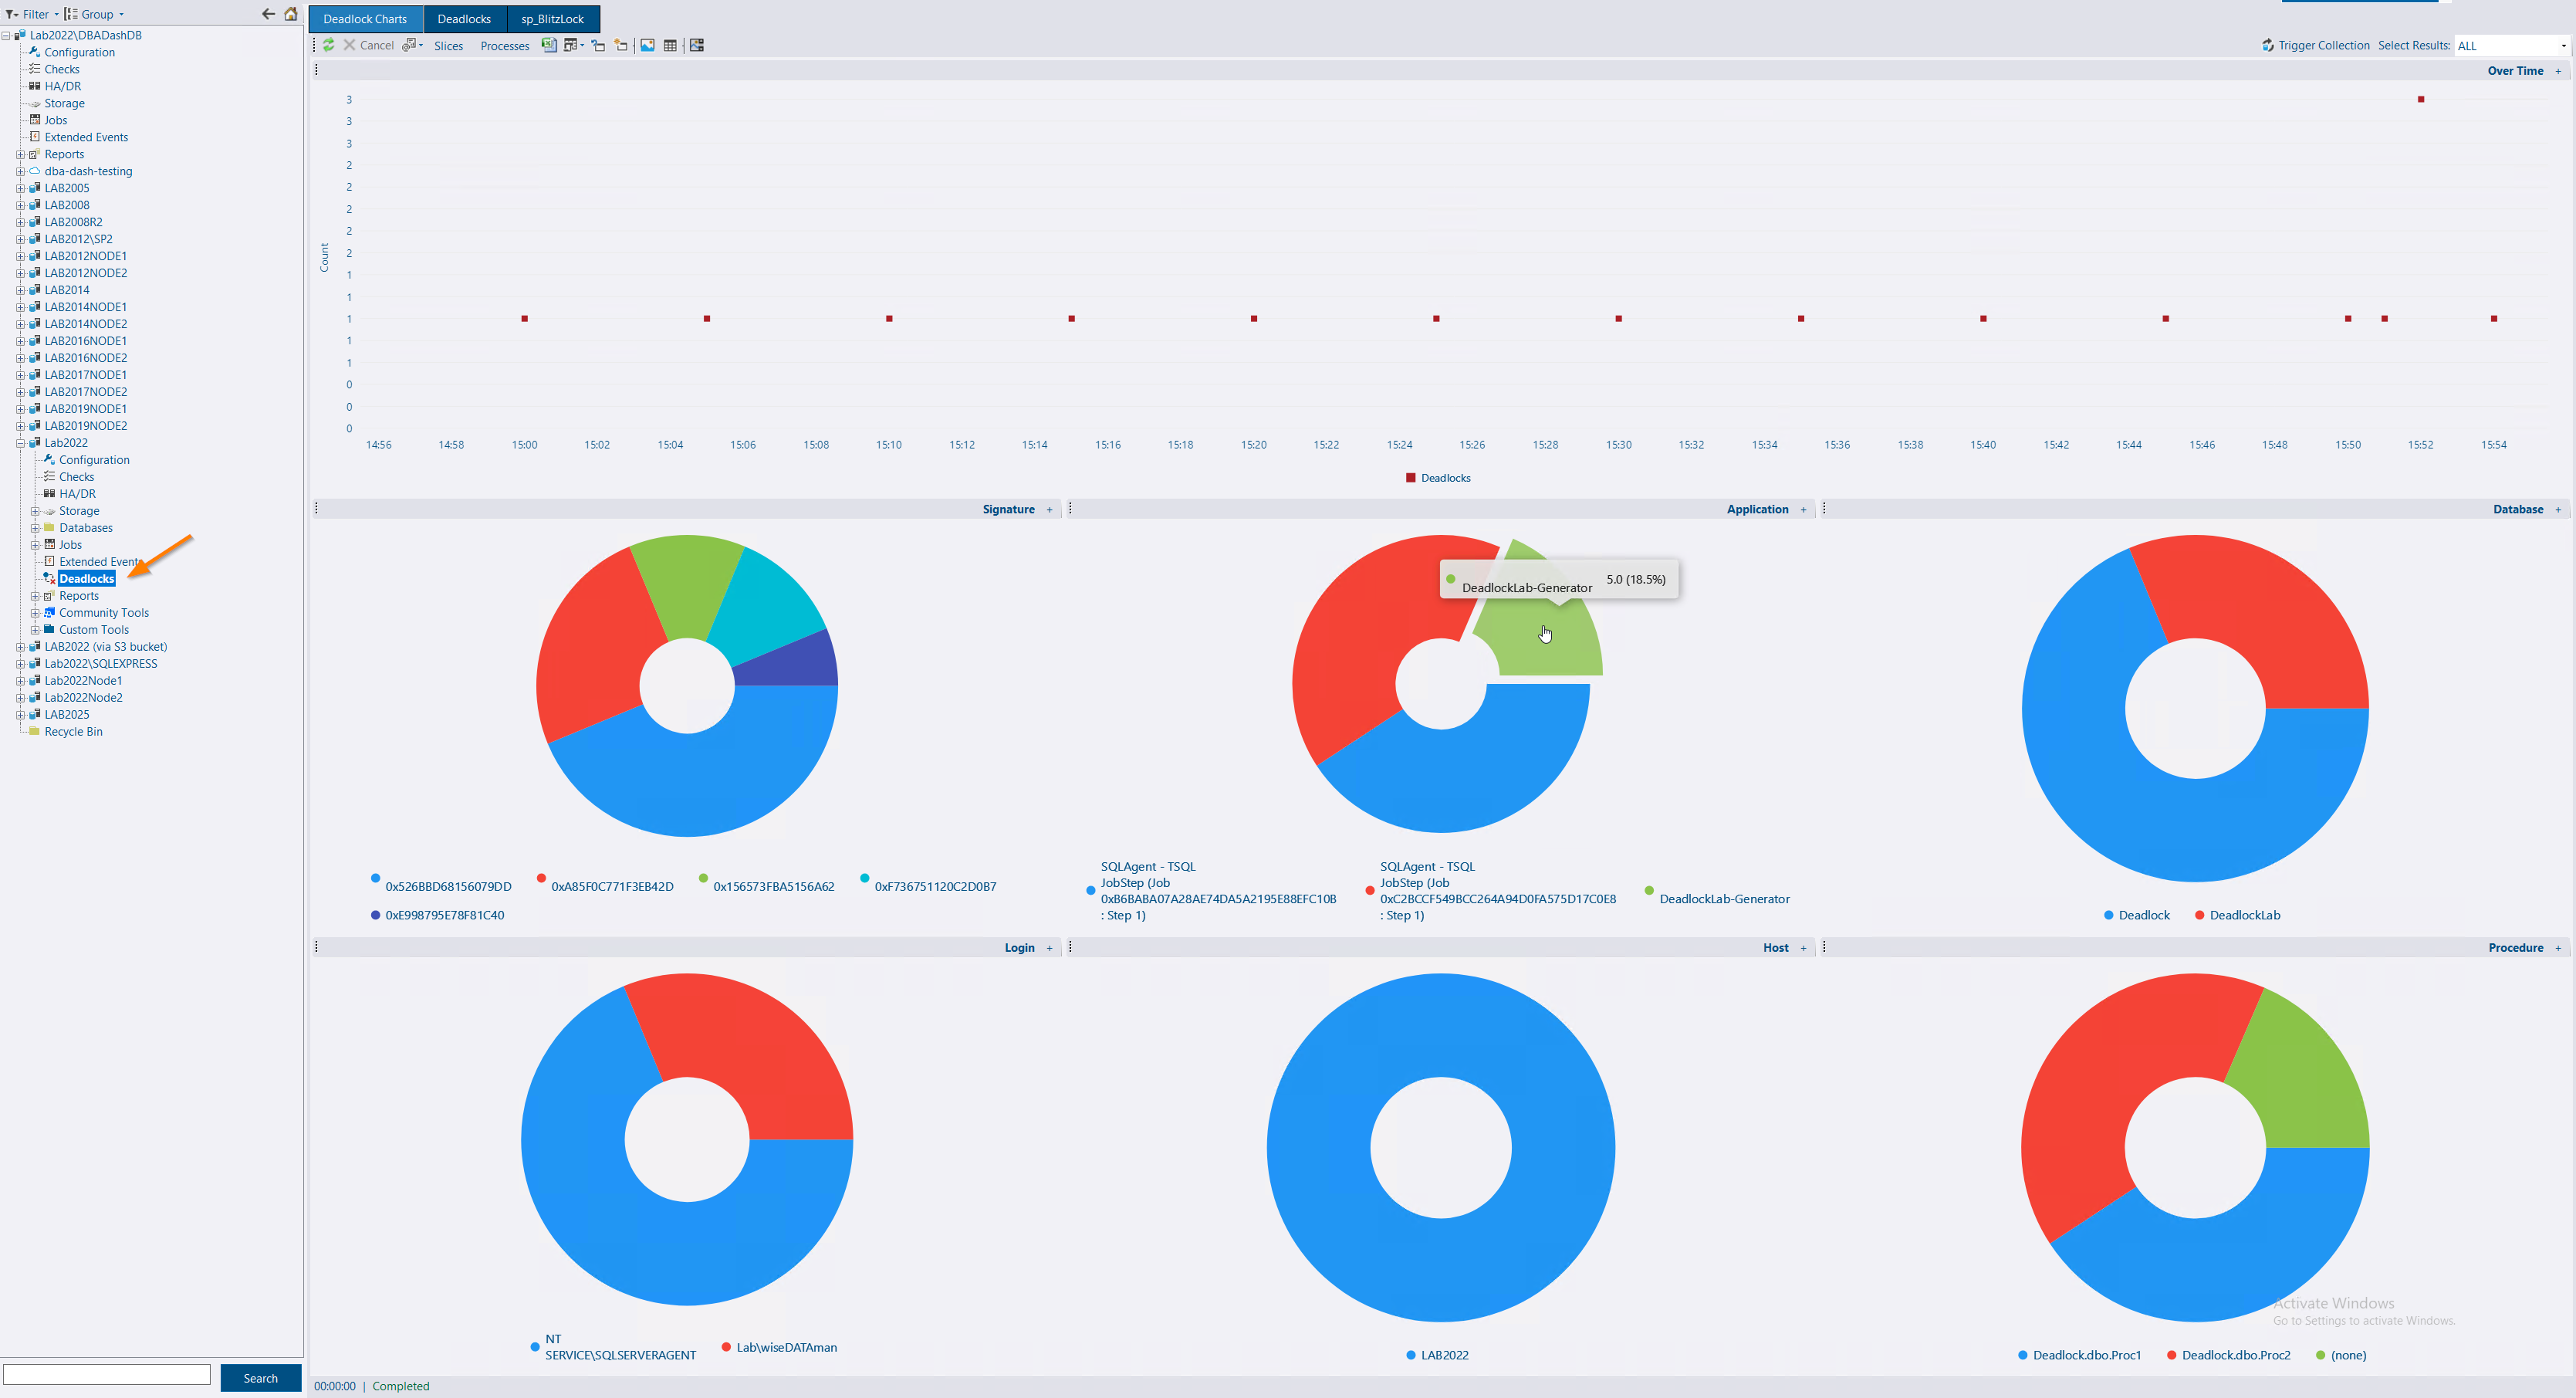
The Deadlock Charts report shows deadlock counts over time, with pie charts highlighting counts by signature, application, database, login, host, or procedure. This provides a high-level overview of where to focus your efforts. The charts support drill-down so you can inspect the detailed information captured for each deadlock. The Deadlocks report provides the same detail for the selected time period.
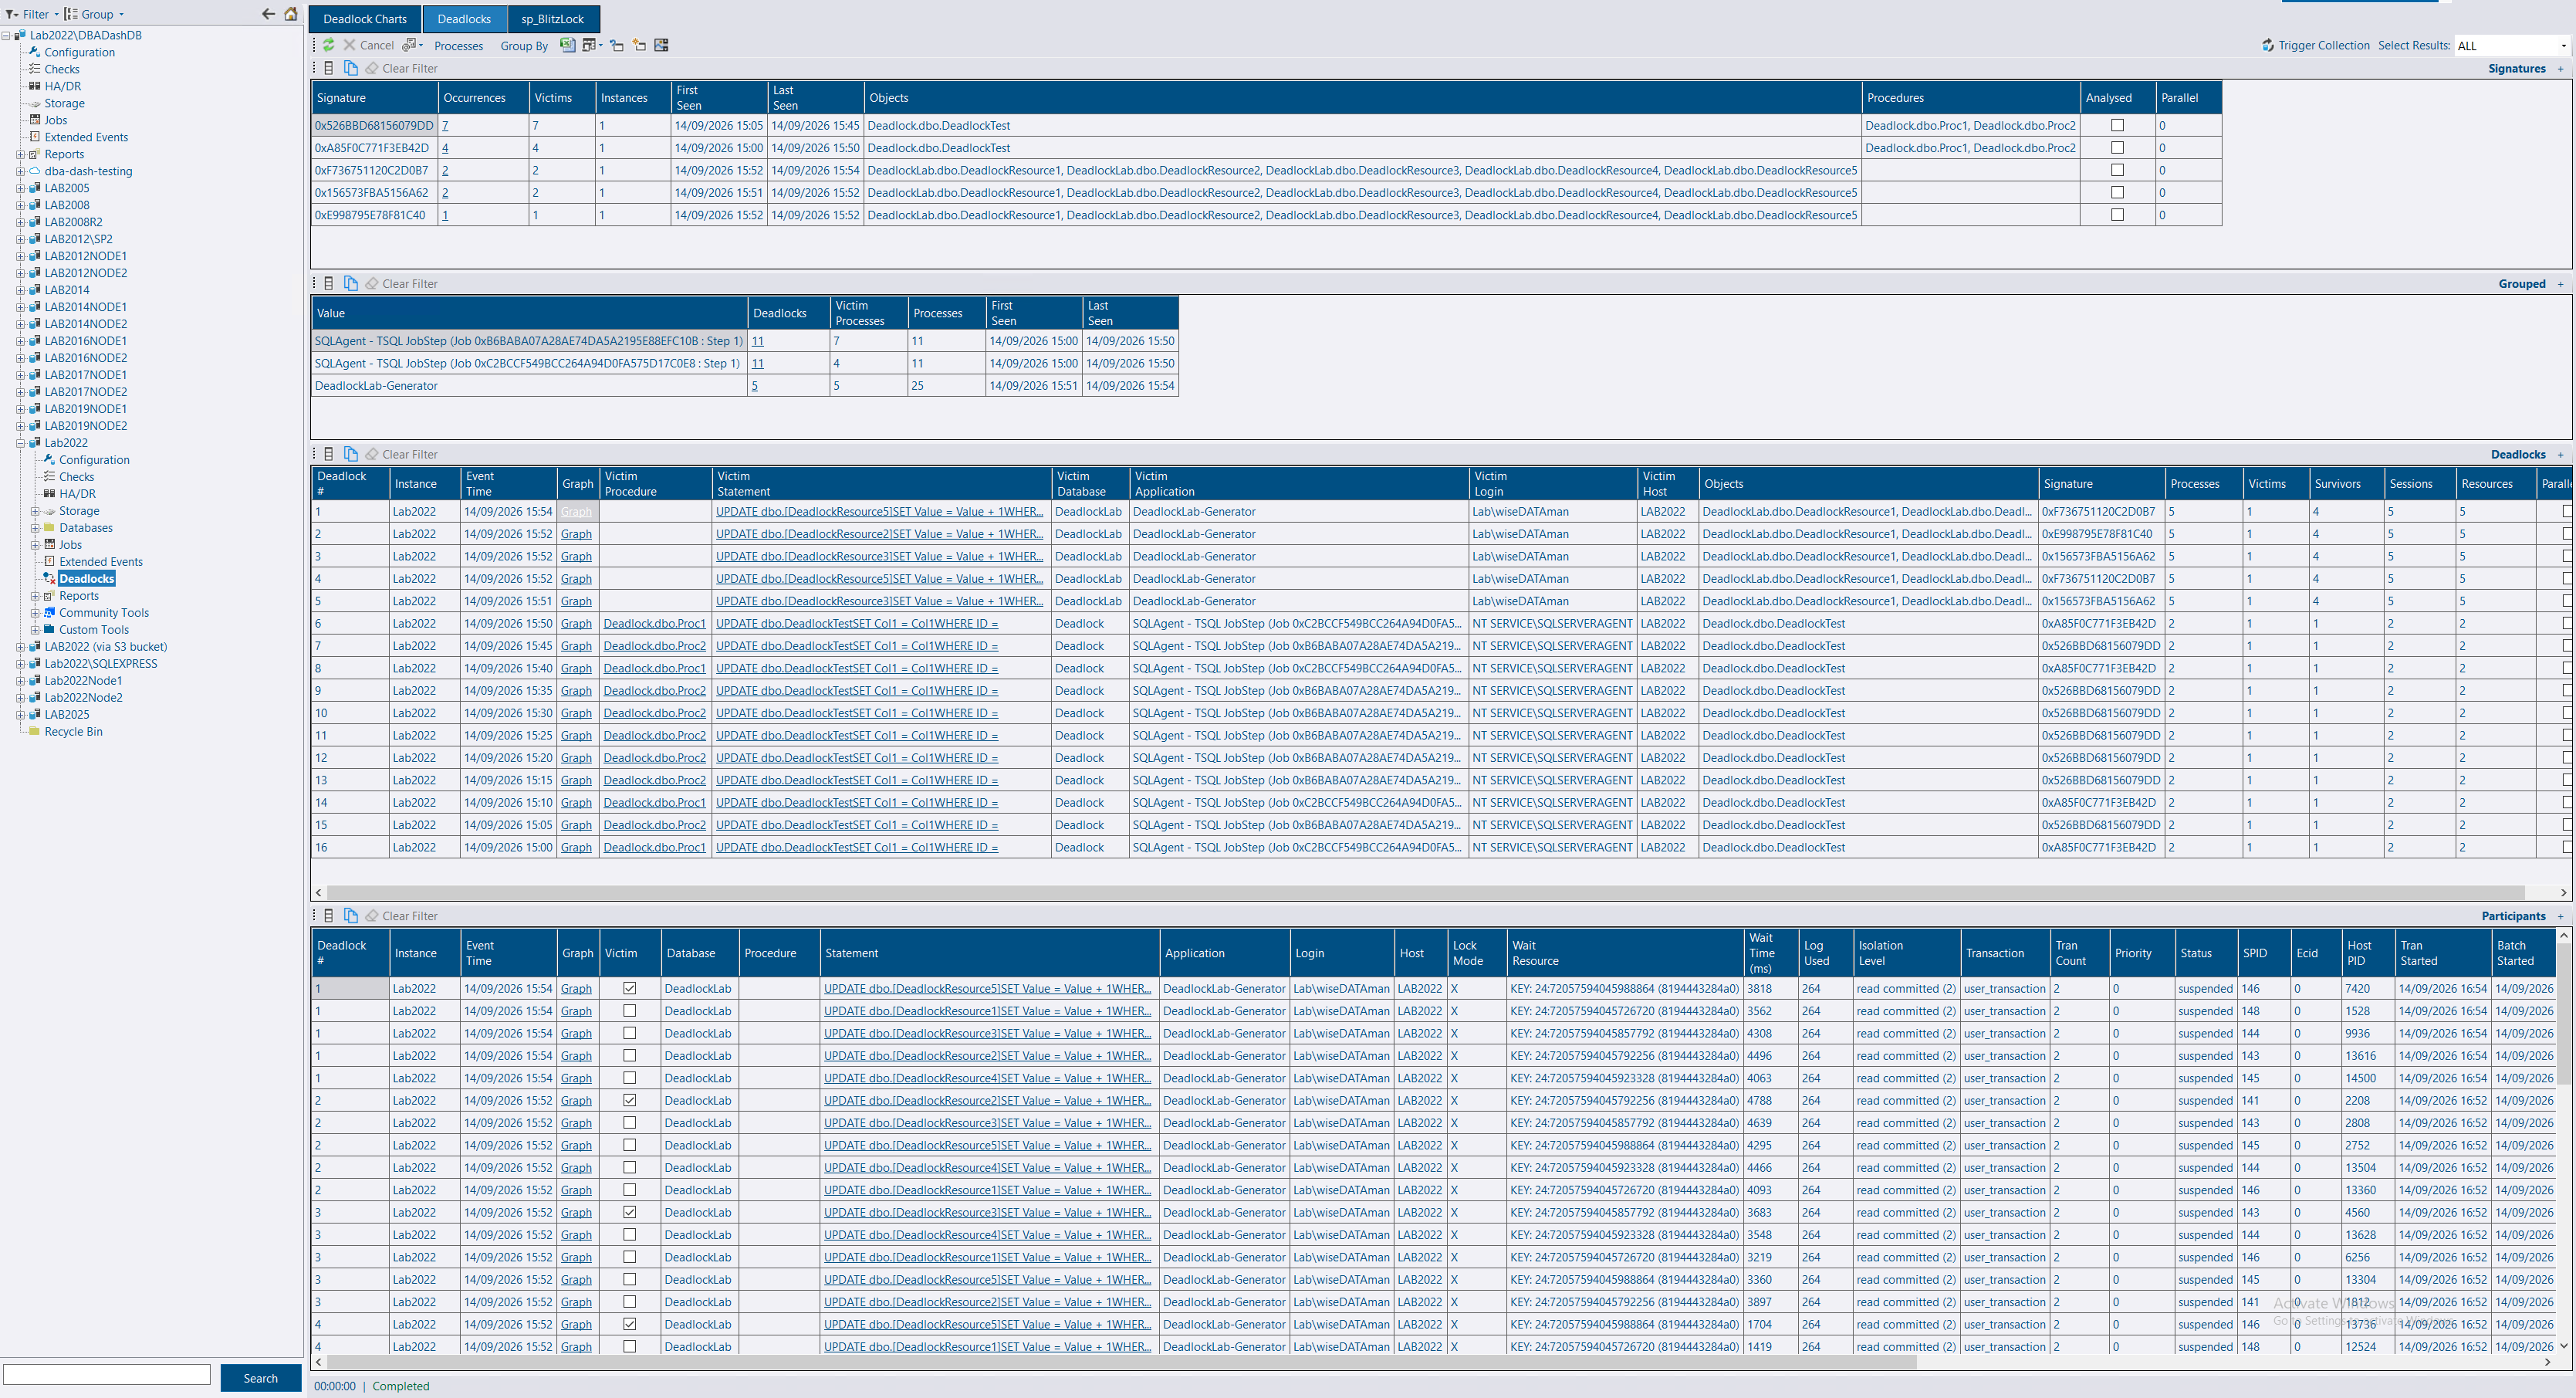
Clicking the Graph link in items 3 and 4 loads the deadlock viewer.
Tip: Want to see an instance’s recent deadlocks before you configure collection? Click Trigger Collection on the Deadlocks report. For an instance that isn’t configured, this reads the existing
system_healthsession once without creating anything on the instance. It requires the messaging feature.
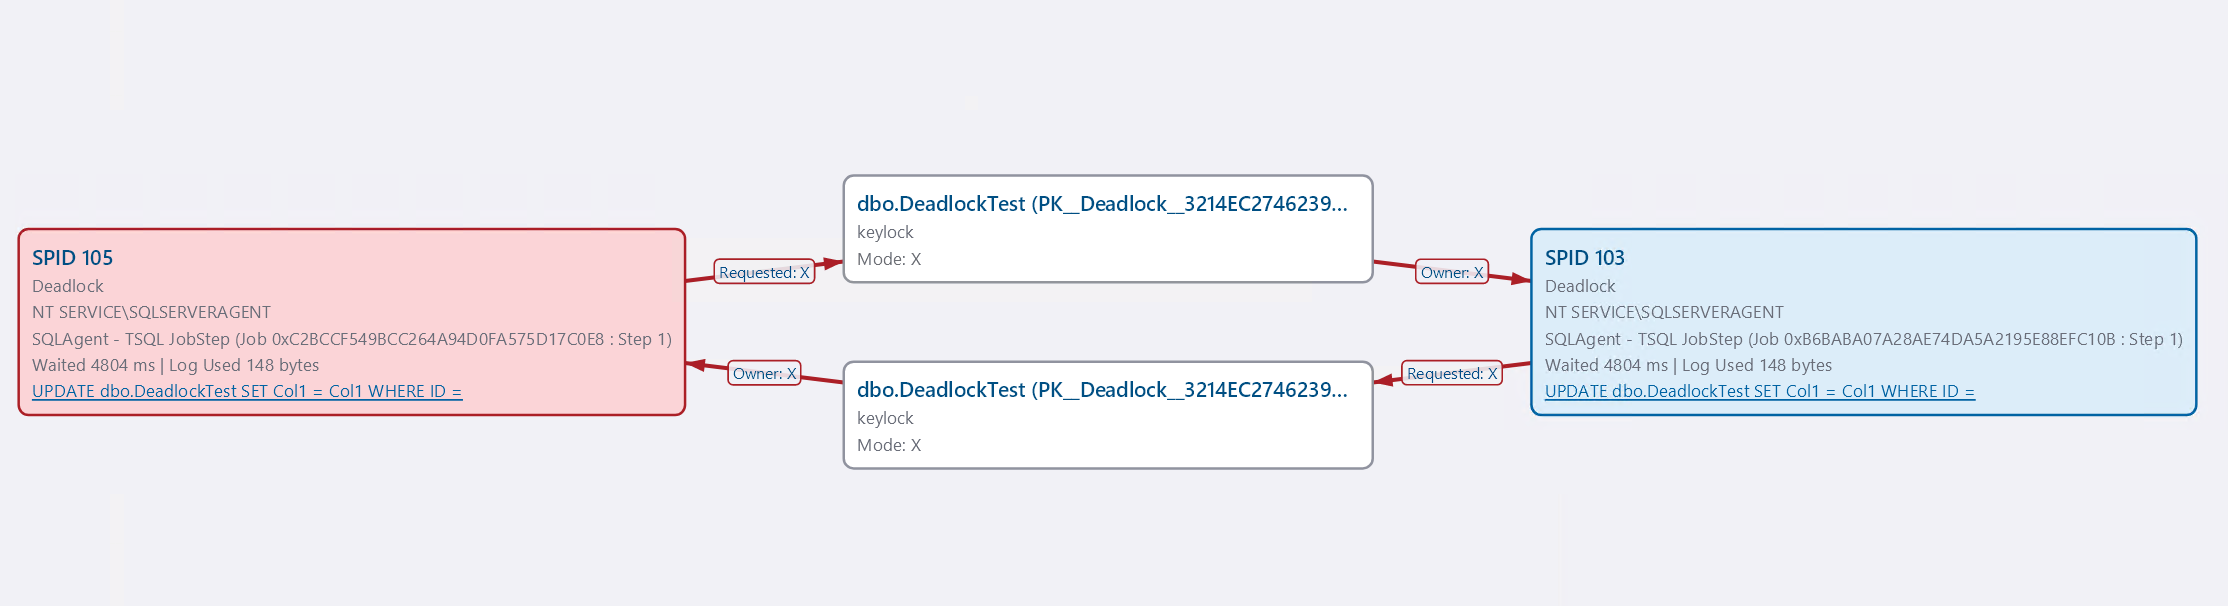
The deadlock viewer lets you visualize the deadlock and inspect the relationships between its processes and resources.
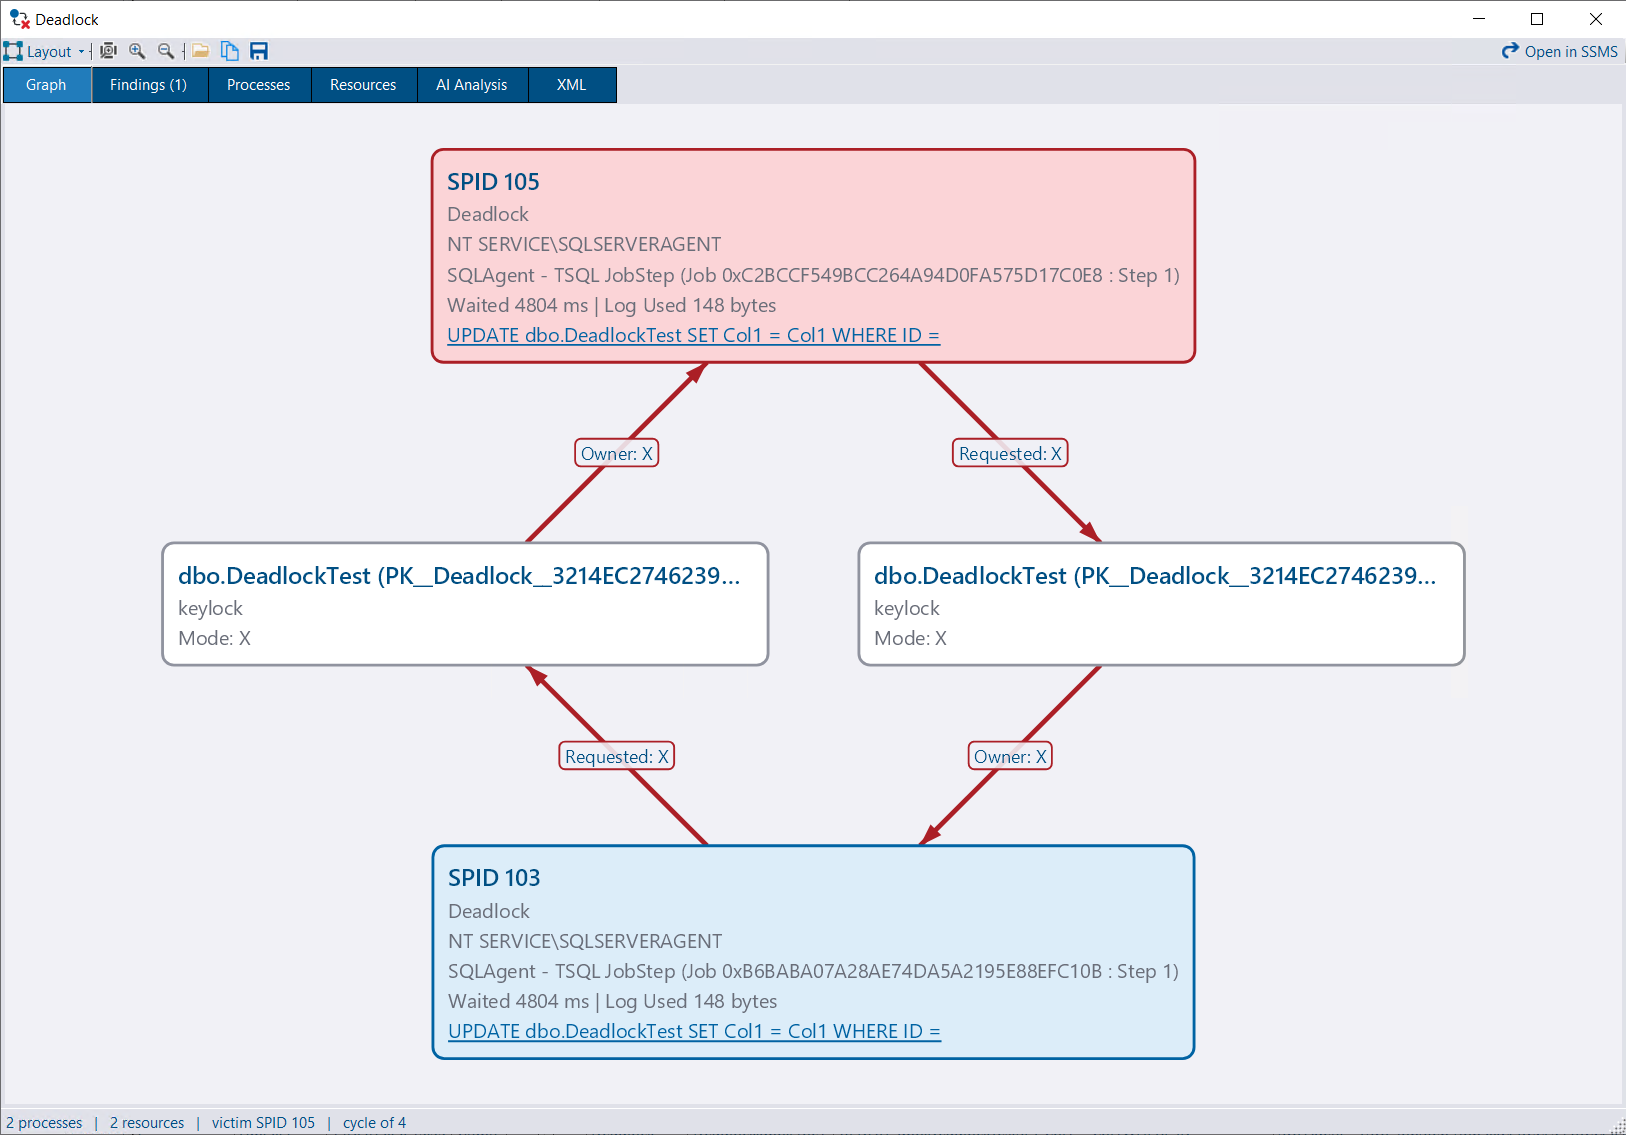
There are two supported view modes: Ring and Column. The Column layout below is similar to SSMS.
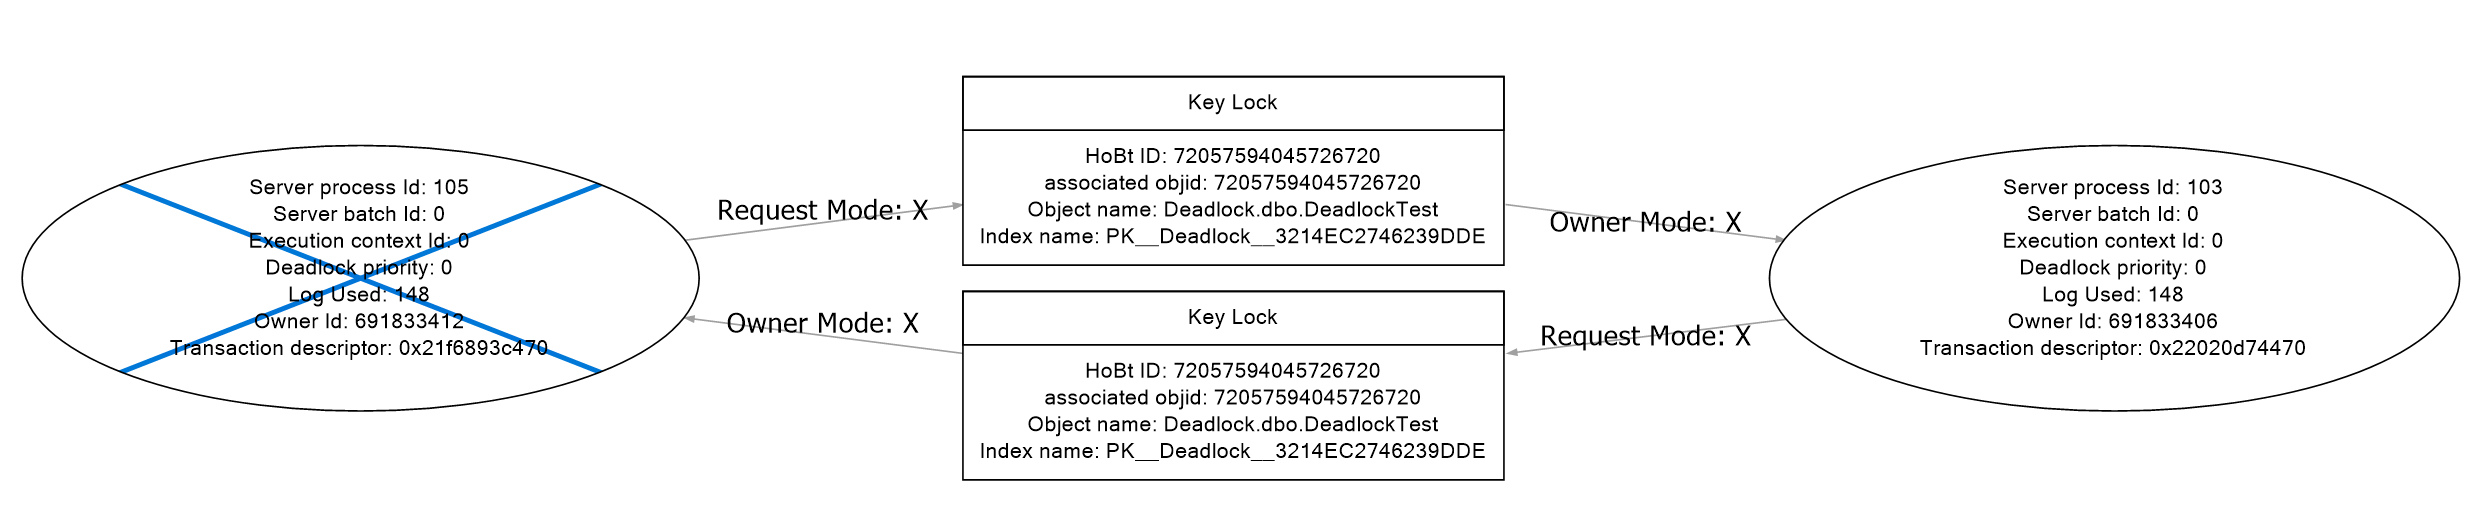
SSMS view of the same deadlock:
The DBA Dash viewer provides several usability improvements over the SSMS viewer. For example, statements are displayed in the chart with a link to load the full statement text in a code viewer, and rich tooltips provide additional context.
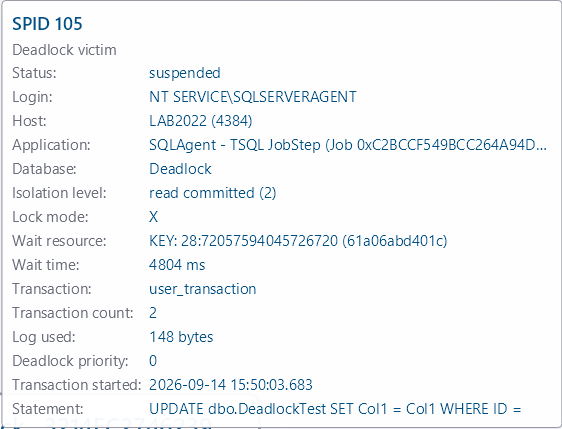
The viewer is also interactive. You can move objects around, similar to SSMS. Clicking an object highlights the resources owned by that object and the resources it wants to access, which is especially useful for more complex graphs.
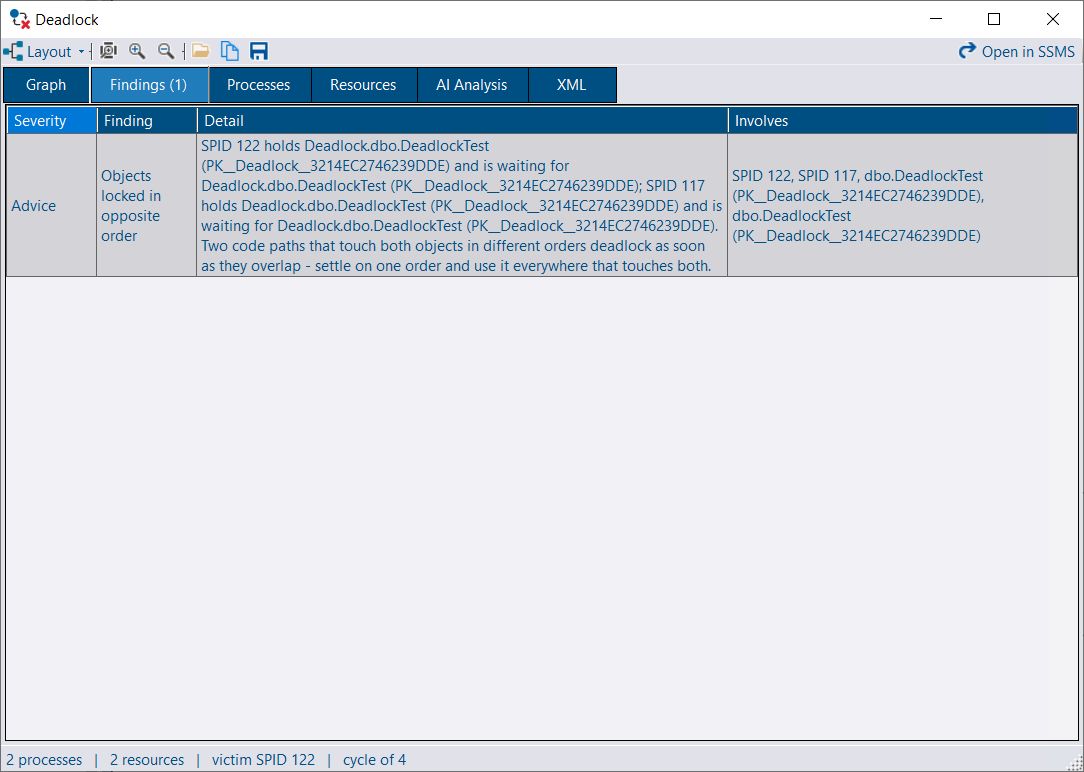
Clicking the Findings tab provides static analysis, with observations and advice that do not require AI.
Or click AI Analysis for detailed, AI-driven observations and recommendations. Nothing is sent until you click Submit for analysis, and the exact request is shown first so you can review it. Deadlock graphs can include parameter values. Previous analyses are kept, so you can compare answers or reuse one for another occurrence of the same deadlock.
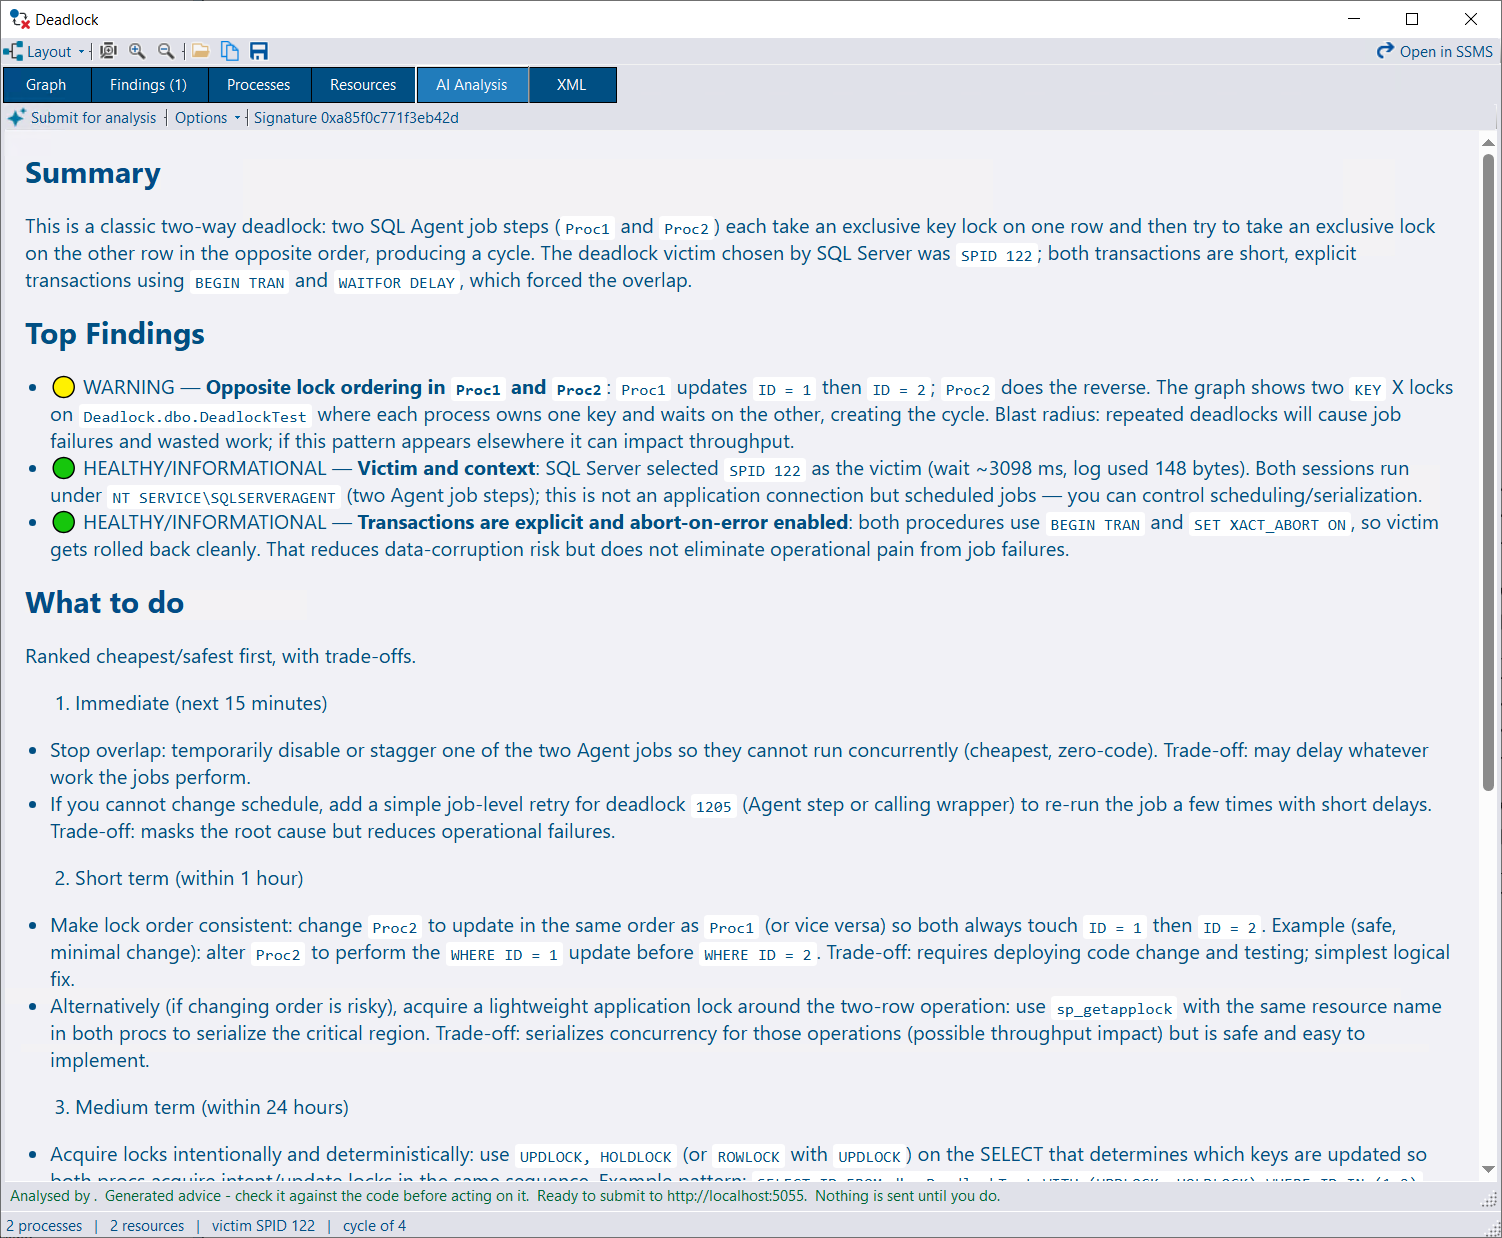
The parsed Processes and Resources data is also available on the relevant tabs.
See the Deadlocks documentation for more on the viewer, signatures, findings and AI analysis.
Read replica monitoring can be added with one click. Read replicas are distinguished in the GUI by a different icon and the (read only) suffix.
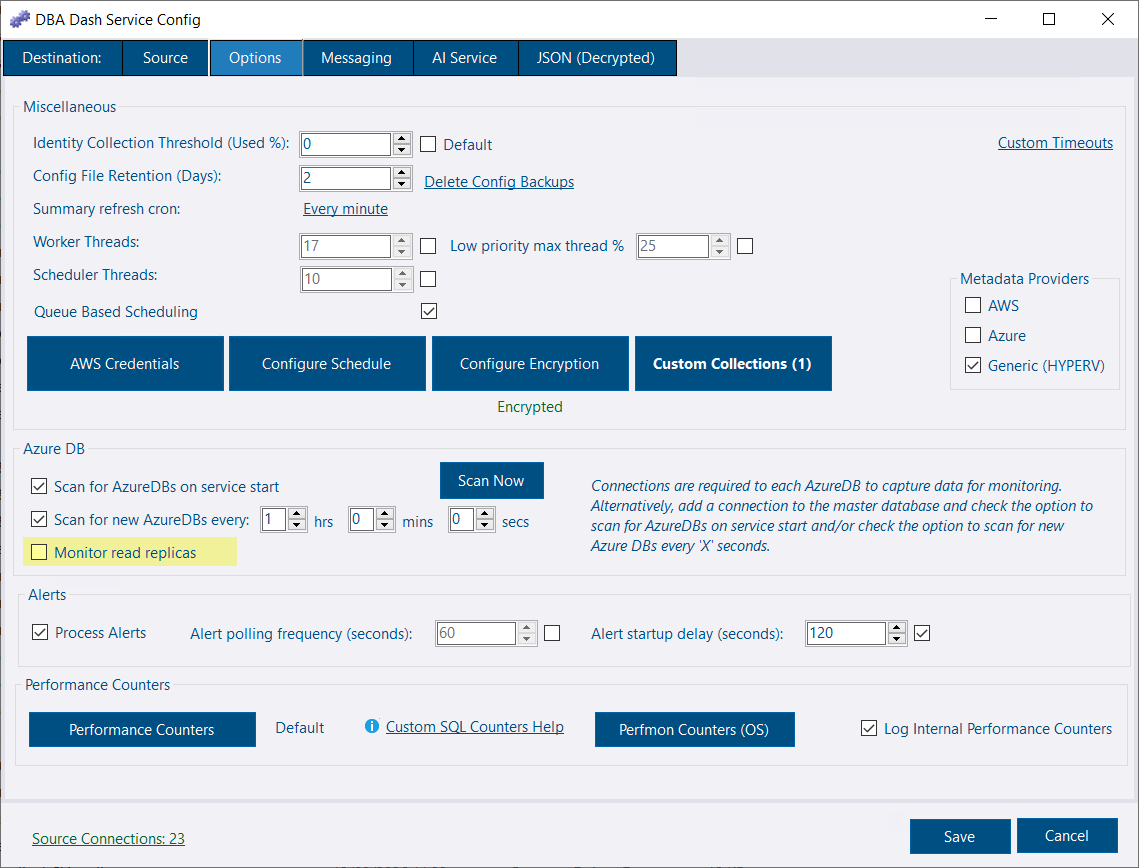
See the 4.18.0 release notes for a full list of fixes and improvements.