Title here
Summary here
September 29, 2026 in Releases by David Wiseman11 minutes

A built-in query plan viewer with plan comparison, the standalone DBA Dash Visualizer, an SSMS extension, and grid data bars.
The 4.18 release added a native deadlock viewer. The 4.19 and 4.20 releases do the same for execution plans, with a built-in query plan viewer that includes static analysis (insights), side-by-side plan comparison, and optional AI analysis.
Both viewers are now also available outside of DBA Dash. DBA Dash Visualizer is a small, standalone app for opening .sqlplan and .xdl files. No repository database, service, or SQL Server connection is required. A new SSMS extension lets you send an execution plan, deadlock graph, or results grid from SSMS straight to the viewer.
Grids across DBA Dash also get data bars, making it easier to spot the values that stand out.
Previously, clicking a query plan in DBA Dash saved a .sqlplan file to a temp folder and opened it with whatever application was registered for that file type. This worked well if you had SSMS or Plan Explorer installed, but not otherwise. Plans now open in a viewer built into DBA Dash. Opening the plan in an external application is still one click away with the Open With button.
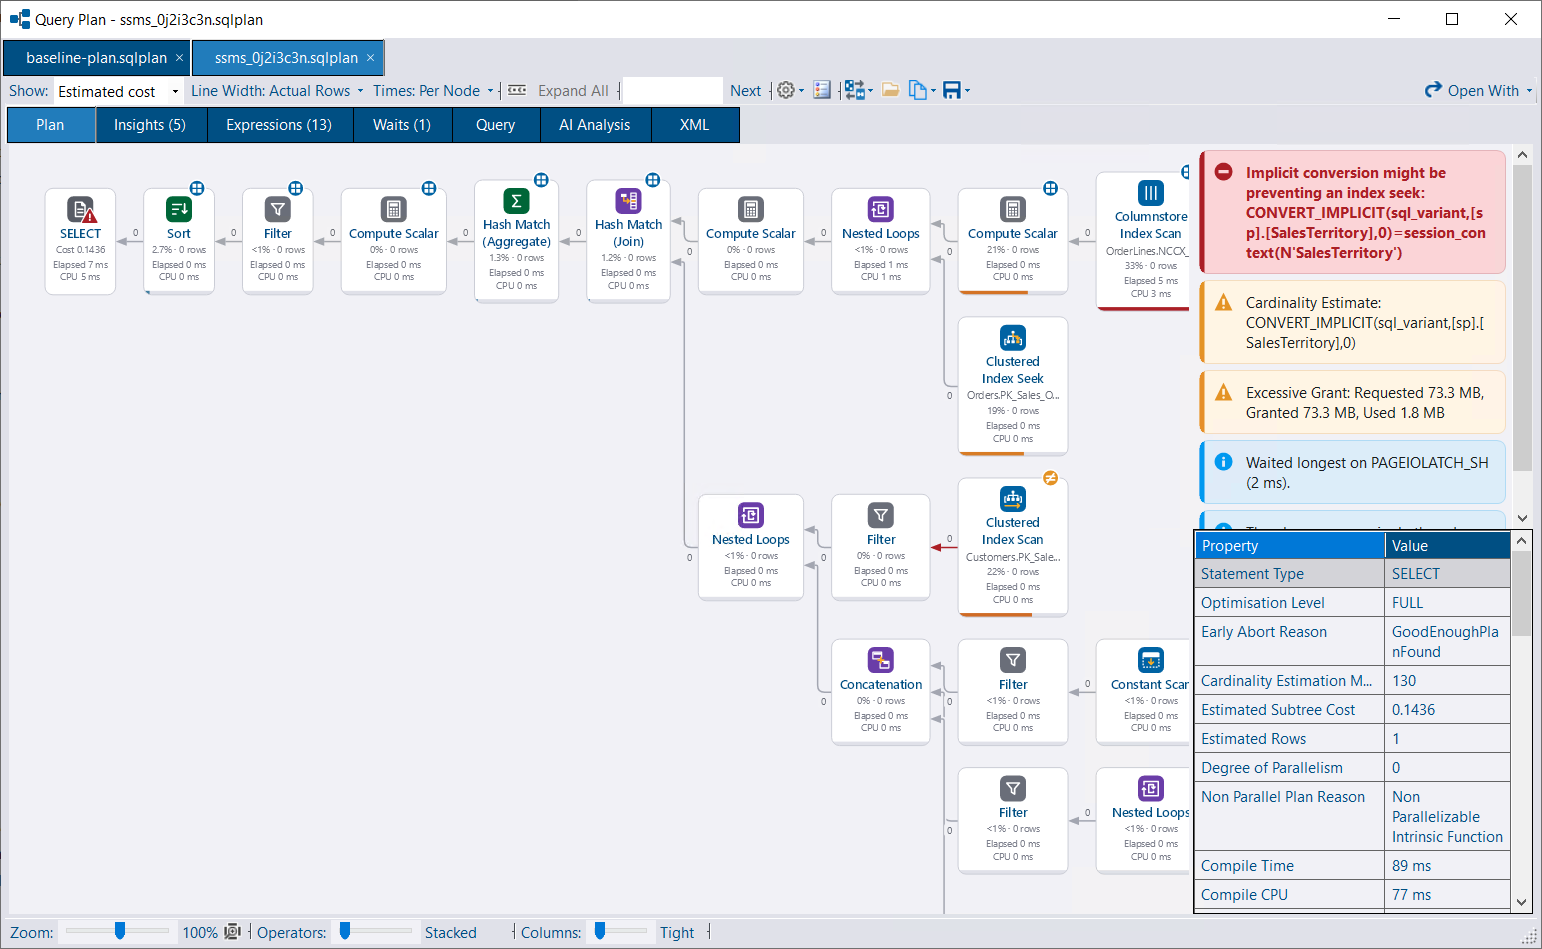
Highlights include:
CREATE INDEX statement), parameters (with compiled and runtime values as DECLARE statements), waits, the statement text, the SET options, and the raw XML. Each item links back to the operator it relates to..sqlplan file.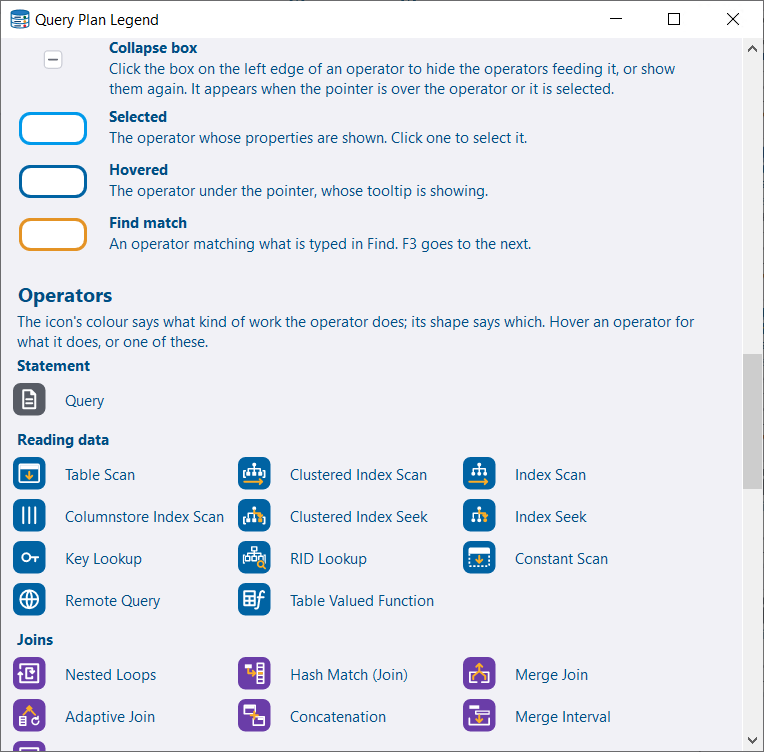
See the Query Plan Viewer documentation for more detail.
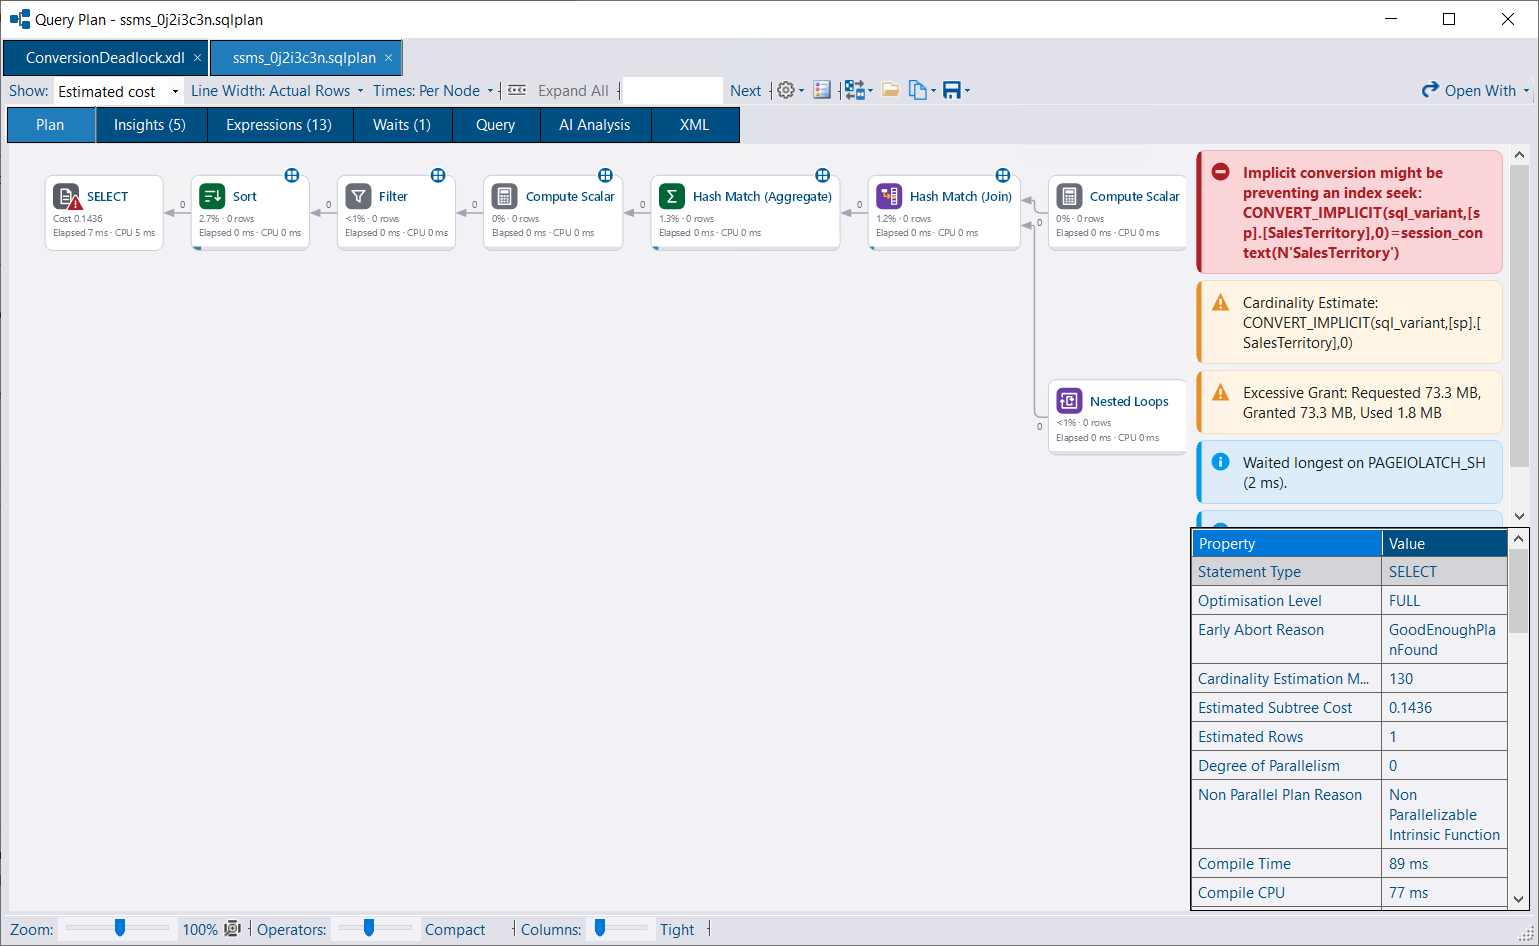
Similar to the Findings tab in the deadlock viewer, the plan viewer performs static analysis of the plan and highlights things worth investigating. This doesn’t require AI. Examples include:
RESOURCE_SEMAPHORE queuing.WHERE (col = @p OR @p IS NULL), ISNULL(@p, col) or COALESCE(@p, col) without OPTION (RECOMPILE). The insight explains why a single cached plan can’t seek on these conditions and lists the fixes, including SQL Server 2025’s optional parameter plan optimization.The Insights tab lists the warnings SQL Server includes in the plan alongside DBA Dash’s own findings, worst first. A Source column shows whether each one came from SQL Server or DBA Dash - the DBA Dash findings are ones you won’t see in SSMS.
The memory grant used by each operator is also shown in the property grid and operator tooltips, making it easier to see where a large grant is going.
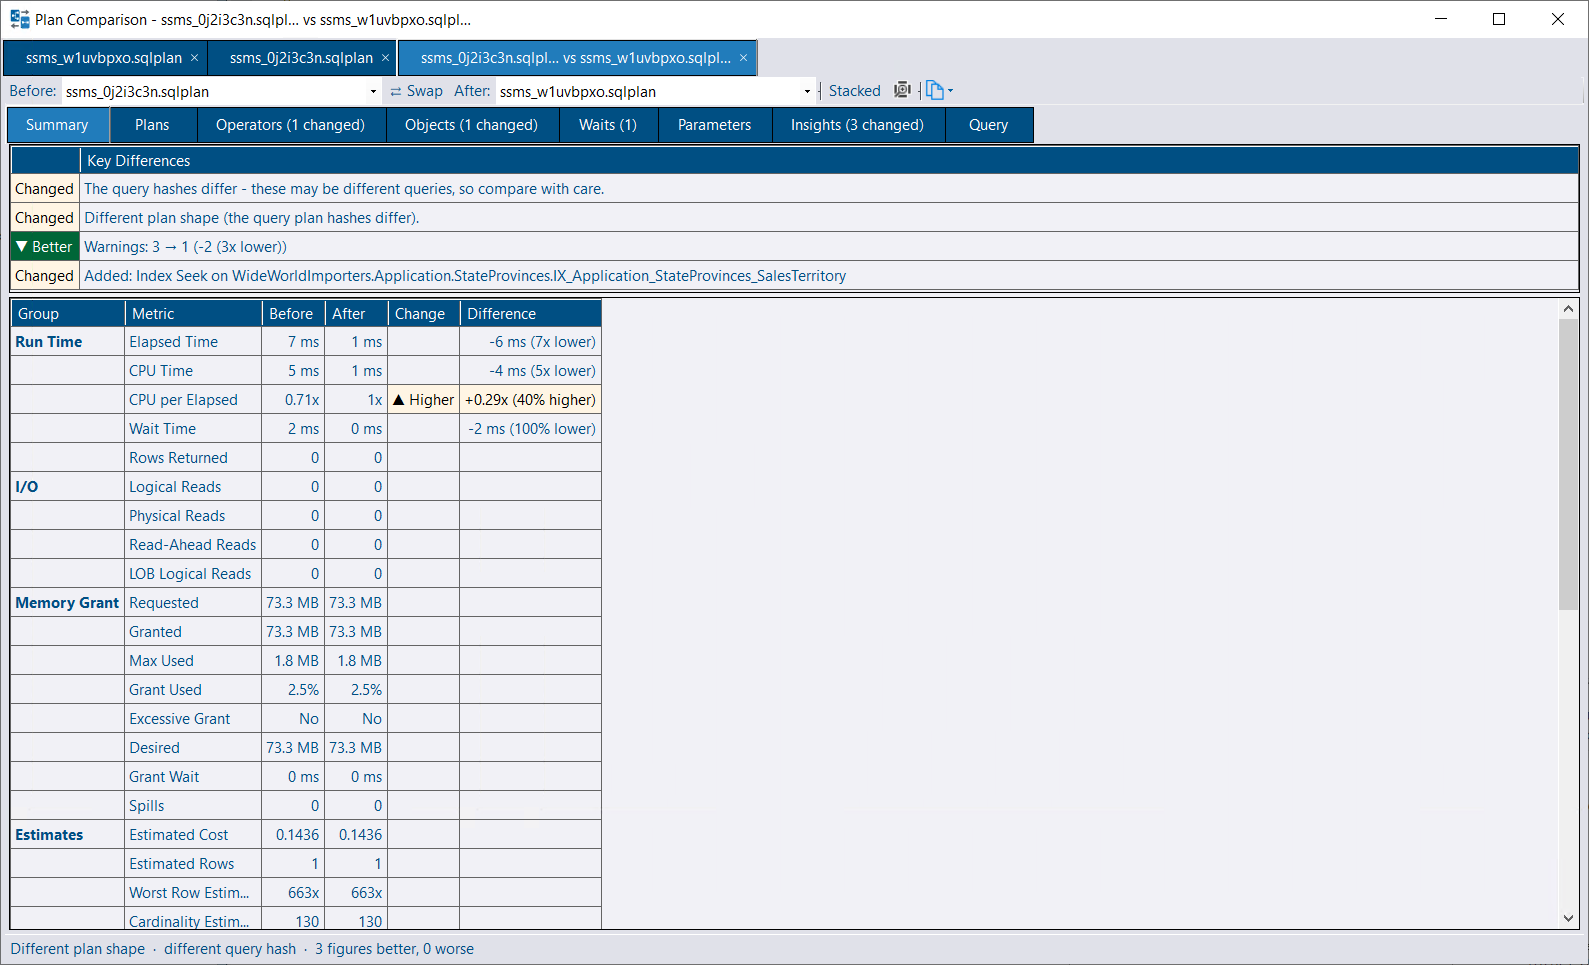
Use the Compare menu on the plan viewer toolbar to compare the current statement with another plan open in the window, another statement in the same plan, or a plan opened from a file. The comparison opens in its own tab. Either side can be switched to any statement of any open plan, or the two can be swapped.
The Summary tab starts with the key differences, followed by statement-level figures - run time, I/O, memory grant, estimates, parallelism, and compilation - with each change marked as better or worse. A noise threshold means small timing differences are treated as similar. Estimated figures such as cost are flagged as weaker signals, and runtime figures aren’t judged against an estimated plan. The summary can be copied as text.
The Plans tab shows the two plans side by side (or stacked), with the selection mirrored between them.
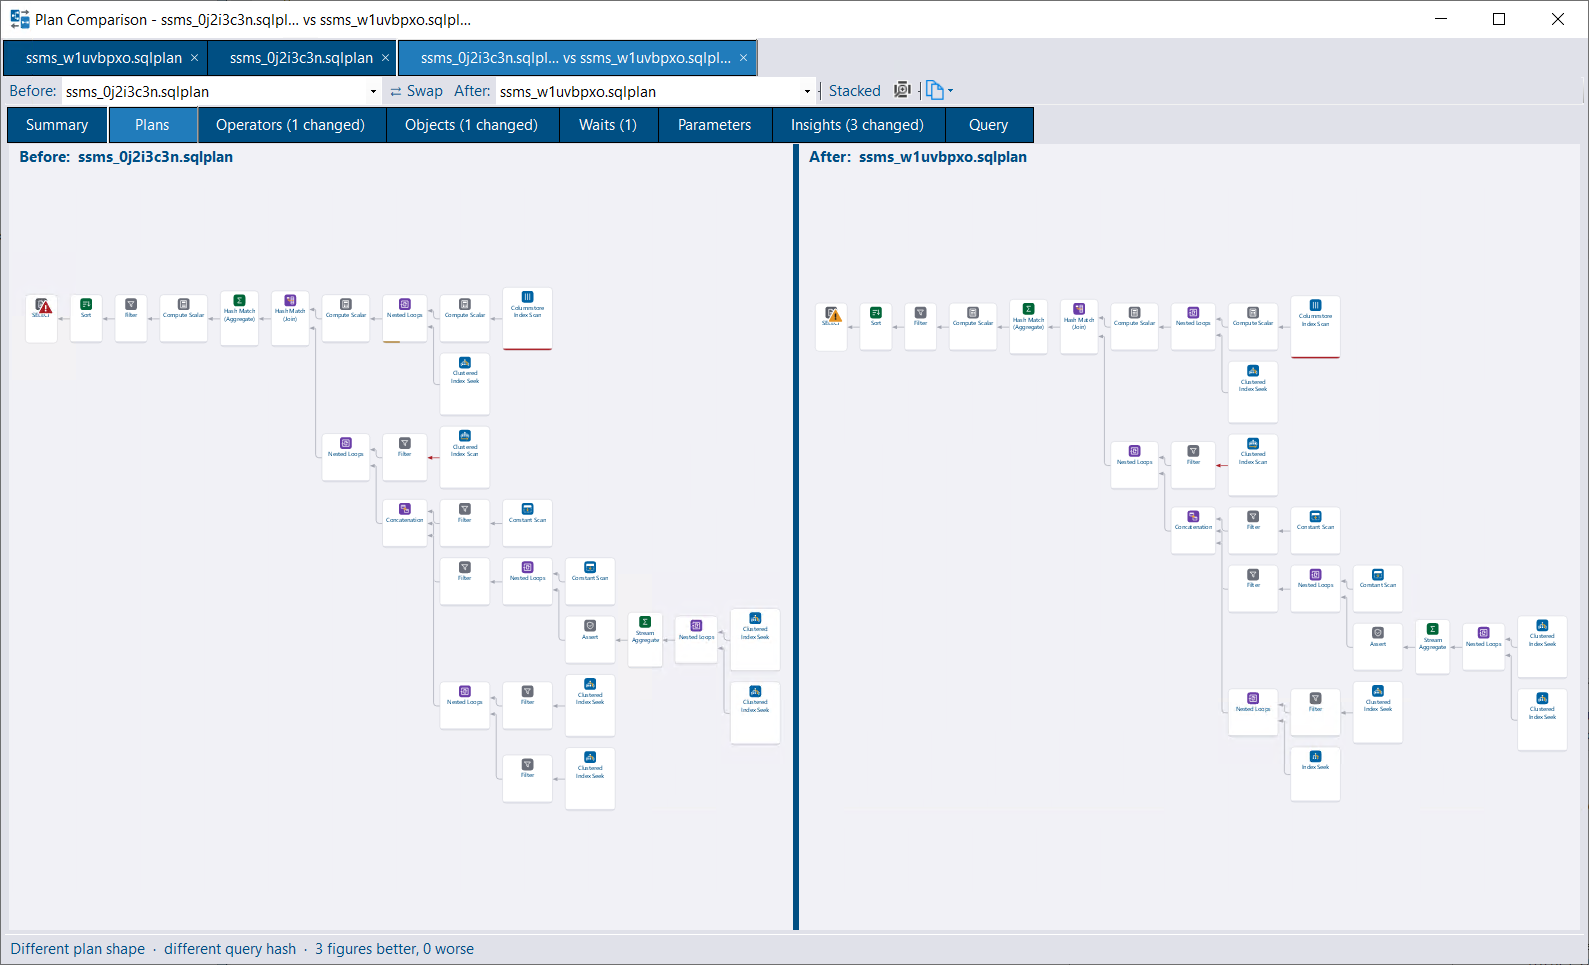
Other tabs compare operators (grouped by type), objects (grouped by table, index, and access method), waits, parameters (including the sniffed compiled values), insights, and the query text, with a side-by-side diff.
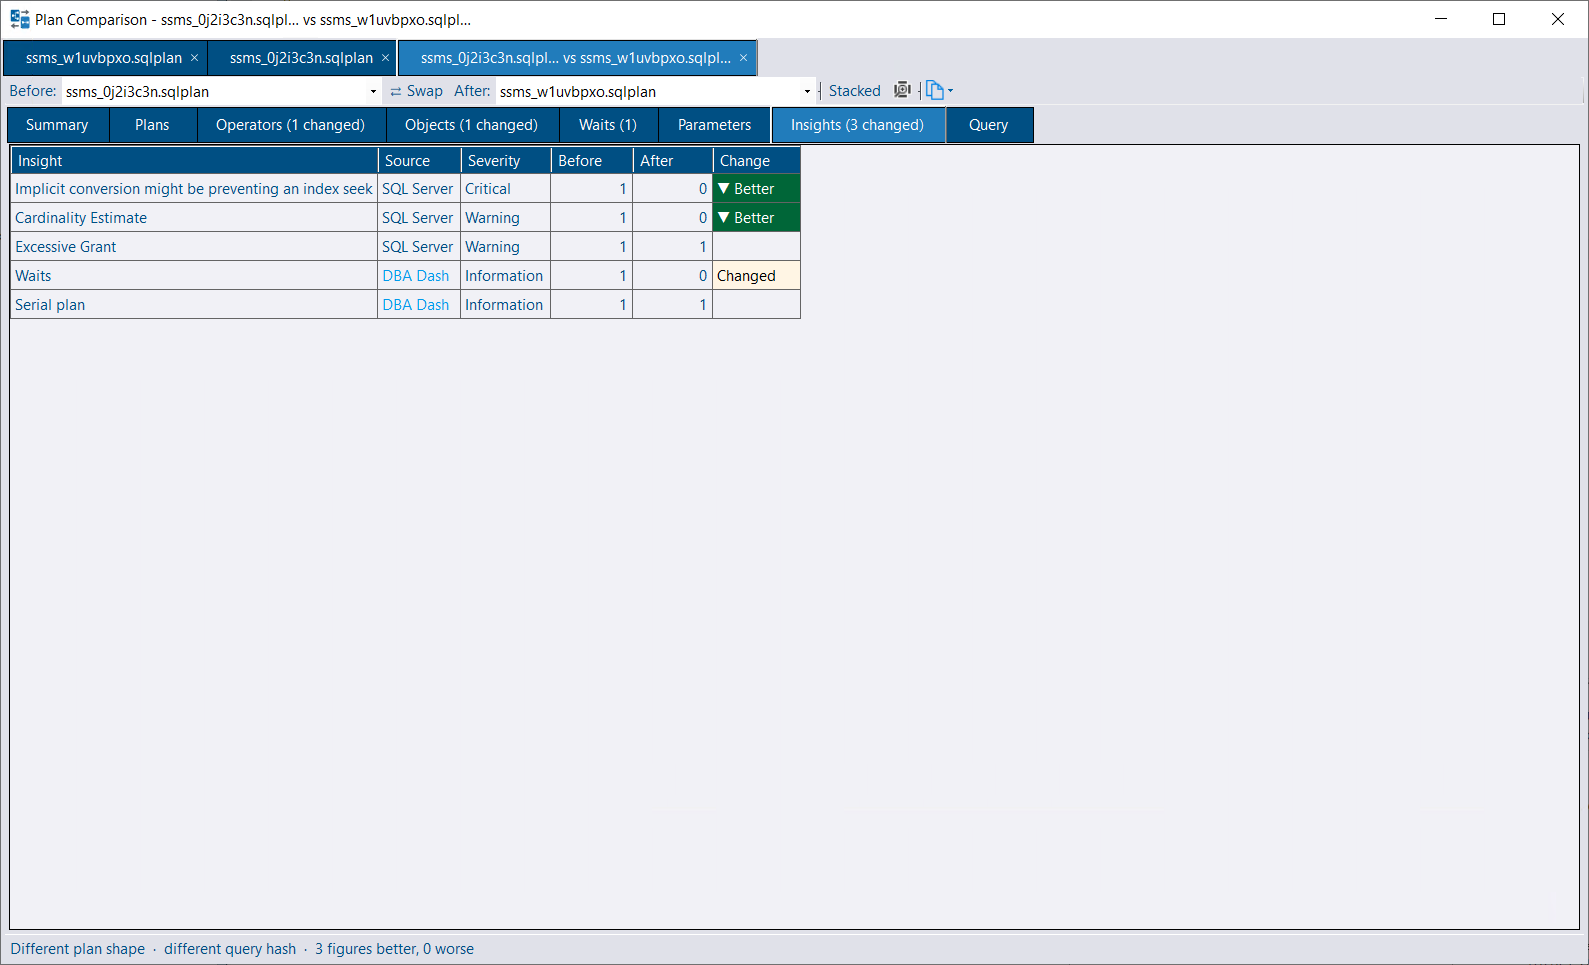
This is useful for investigating a plan regression, or for checking that a tuning change had the effect you expected.
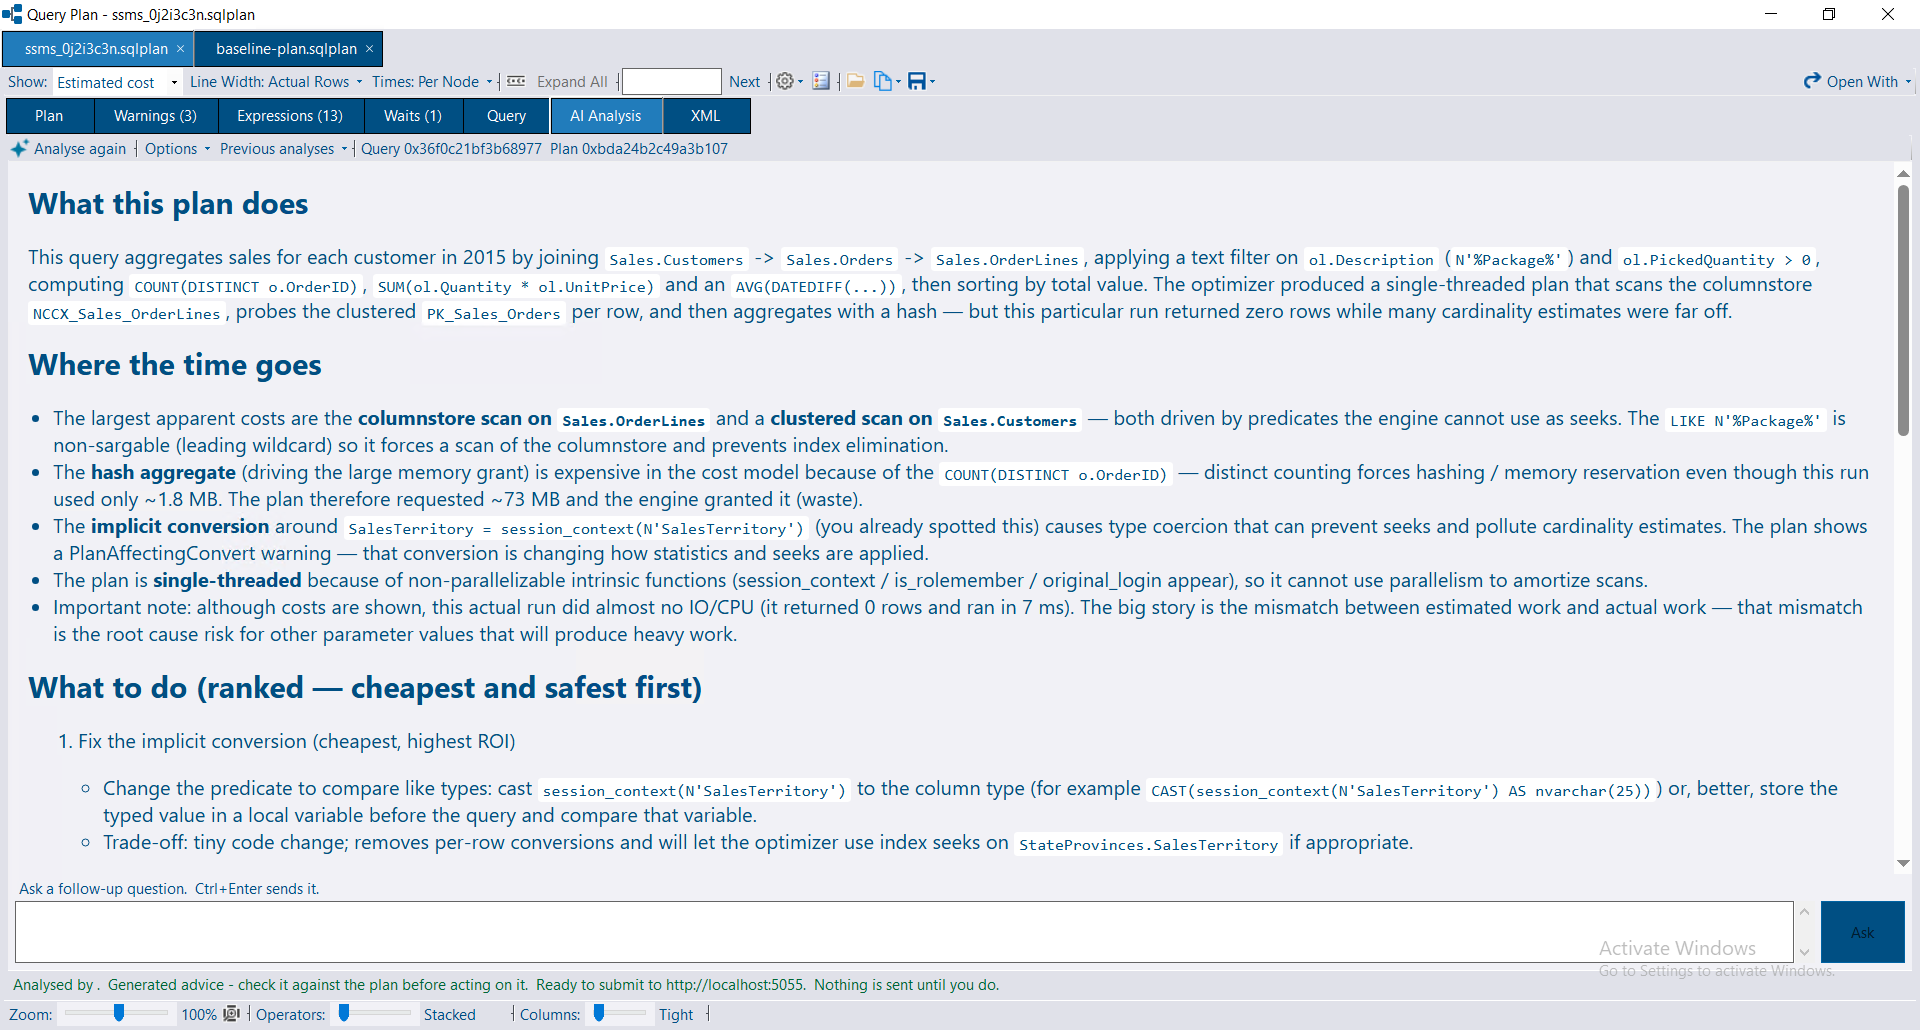
With the AI Service configured, you can ask AI to analyze a plan, the same way as for deadlocks. As before, nothing is sent until you click Submit for analysis, and the exact request is shown first so you can review it.
The analysis is scoped to the selected statement and includes the plan XML along with what the viewer already knows: insights, missing indexes, waits, parameters, and the operators ranked by their own cost. For very large plans, the XML is excluded by default. You can choose to include it, and the size is shown in tokens so you know what you are sending.
Analyses are stored against the query hash and query plan hash, so you can view previous answers for the same query - including answers about a different plan for the same query, which can be useful when investigating a plan regression.
Both the plan and deadlock viewers now also support follow-up questions, so you can continue the conversation rather than getting a single answer. The initial analysis is stored in the repository database and shared with other users. Your follow-up questions and answers are private to you. They are stored locally and protected with Windows DPAPI.
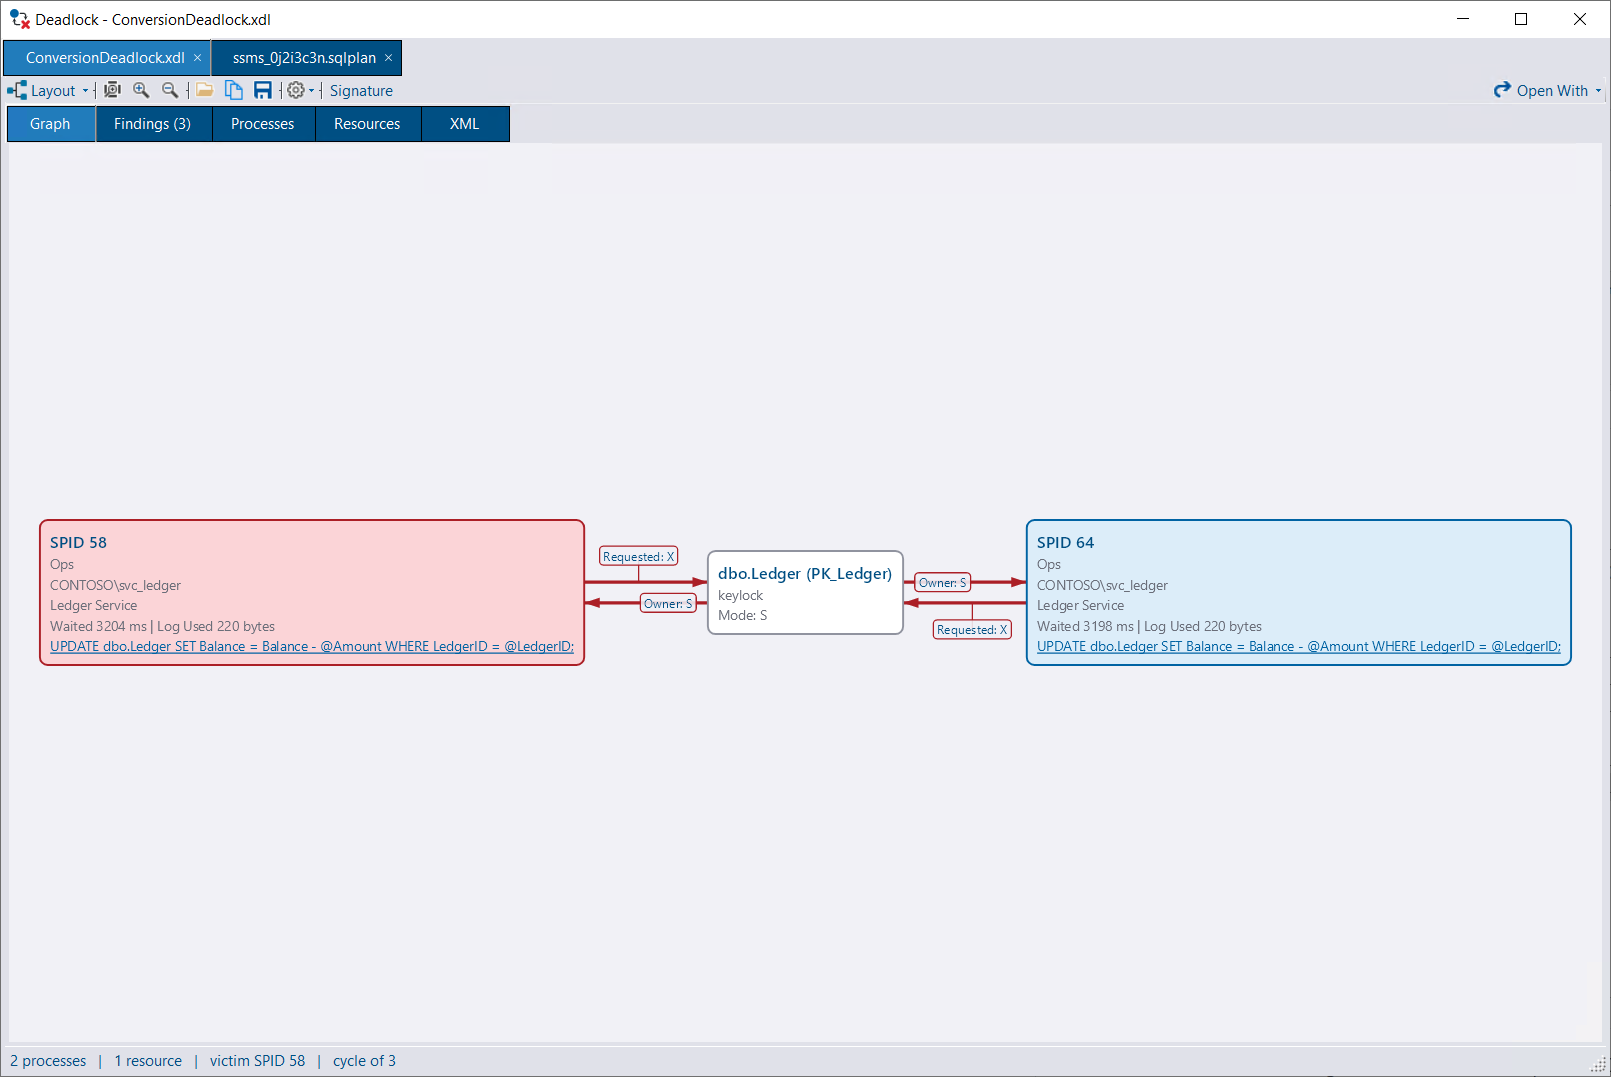
The deadlock viewer now has a properties grid showing full process details, including the full execution stack. It also uses the same tabbed interface as the plan viewer, instead of opening a new window for each deadlock.
Plans open automatically when you click a query plan link in DBA Dash. You can also use Tools > Open Query Plan, drag and drop .sqlplan files onto the viewer, or pass them on the command line. DBA Dash can optionally register itself as a handler for .sqlplan files, in the same way it already could for .xdl files. When several files are opened at once from Explorer, they open as tabs in a single window.
DBA Dash Visualizer is a new standalone app containing the same plan and deadlock viewers as DBA Dash. It’s for when you have a plan or a deadlock graph and don’t have DBA Dash - no repository, service, SQL Server connection, or monitored instance is needed. Features that depend on DBA Dash, such as AI analysis and Query Store lookups, are not included.
There are two ways to install it:
DBADash_Visualizer_Setup_<version>.exe from the latest release. It installs in a few seconds for the current user only, so no administrator rights are required. It adds a Start menu entry, installs the .NET Desktop Runtime if it’s missing, and updates itself.DBADash_Visualizer_<version>.zip and extract it to a folder of your choice (xcopy deployment).The Visualizer can register itself for .sqlplan and .xdl files so it appears in Explorer’s Open with menu. It checks for updates at most once a day. See the DBA Dash Visualizer documentation for full details.
The release page now includes a table to help you pick the right download:
| I want to… | Download |
|---|---|
| Set up monitoring (repository DB + service + GUI) | DBADash_<version>.zip |
| Add a monitoring client on another machine | DBADash_GUI_Only_<version>.zip |
| View query plans/deadlocks only - no monitoring (installer, auto-updates) | DBADash_Visualizer_Setup_<version>.exe |
| View query plans/deadlocks only - no monitoring (xcopy deployment) | DBADash_Visualizer_<version>.zip |
A new extension for SSMS 21 and 22 adds an Open in DBA Dash Visualizer option to SSMS:
sp_BlitzLock.The option is also available on the Tools menu, with Ctrl+Alt+Shift+D as a keyboard shortcut. Items open in the DBA Dash Visualizer, or in DBA Dash if the Visualizer isn’t installed.
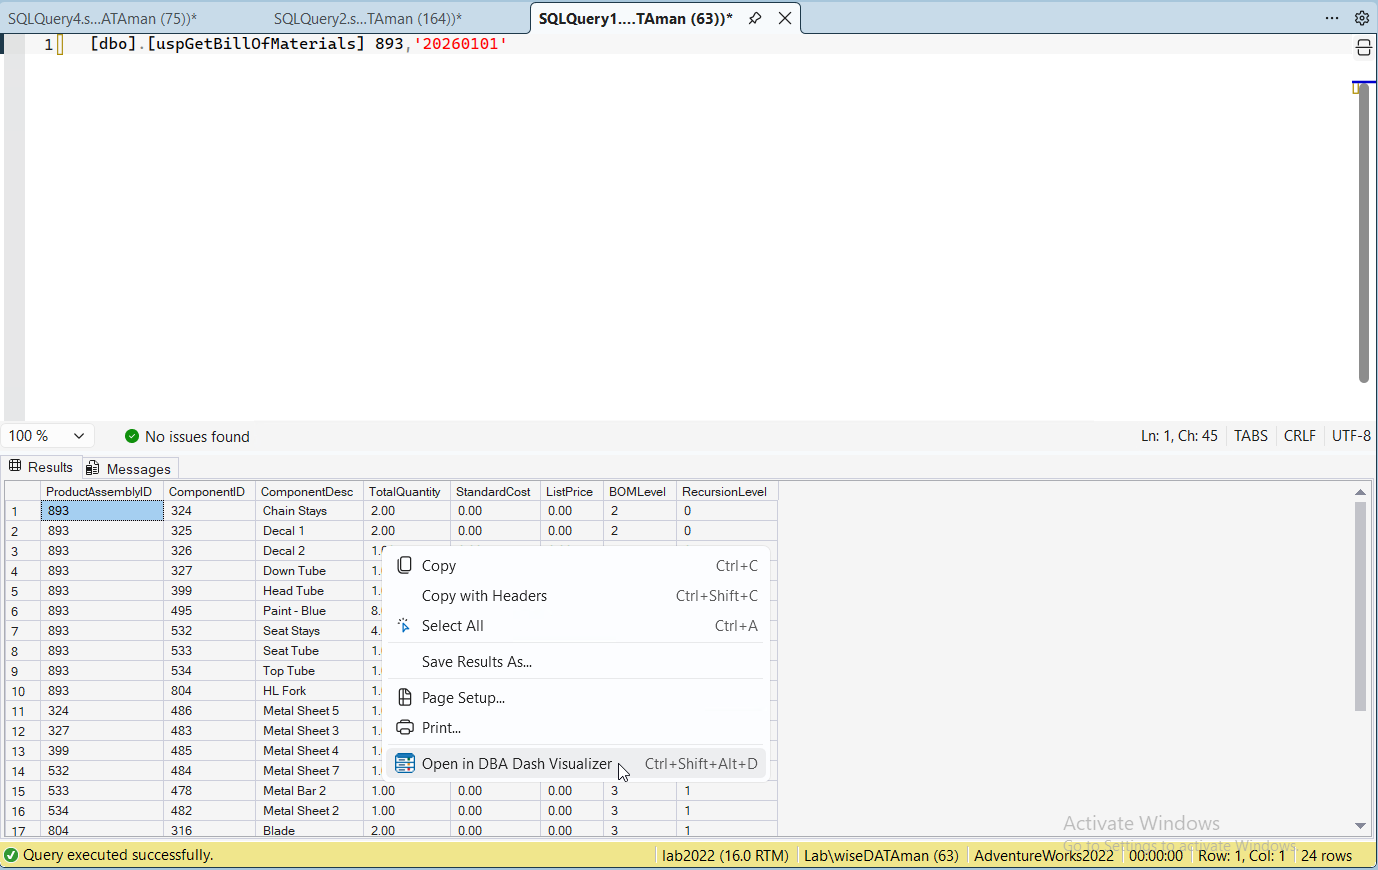
Opening a results grid gives you sorting, filtering, Group By, and export options that aren’t available in SSMS. XML and JSON columns are shown as links, and plans or deadlock graphs in a cell open in their viewers.
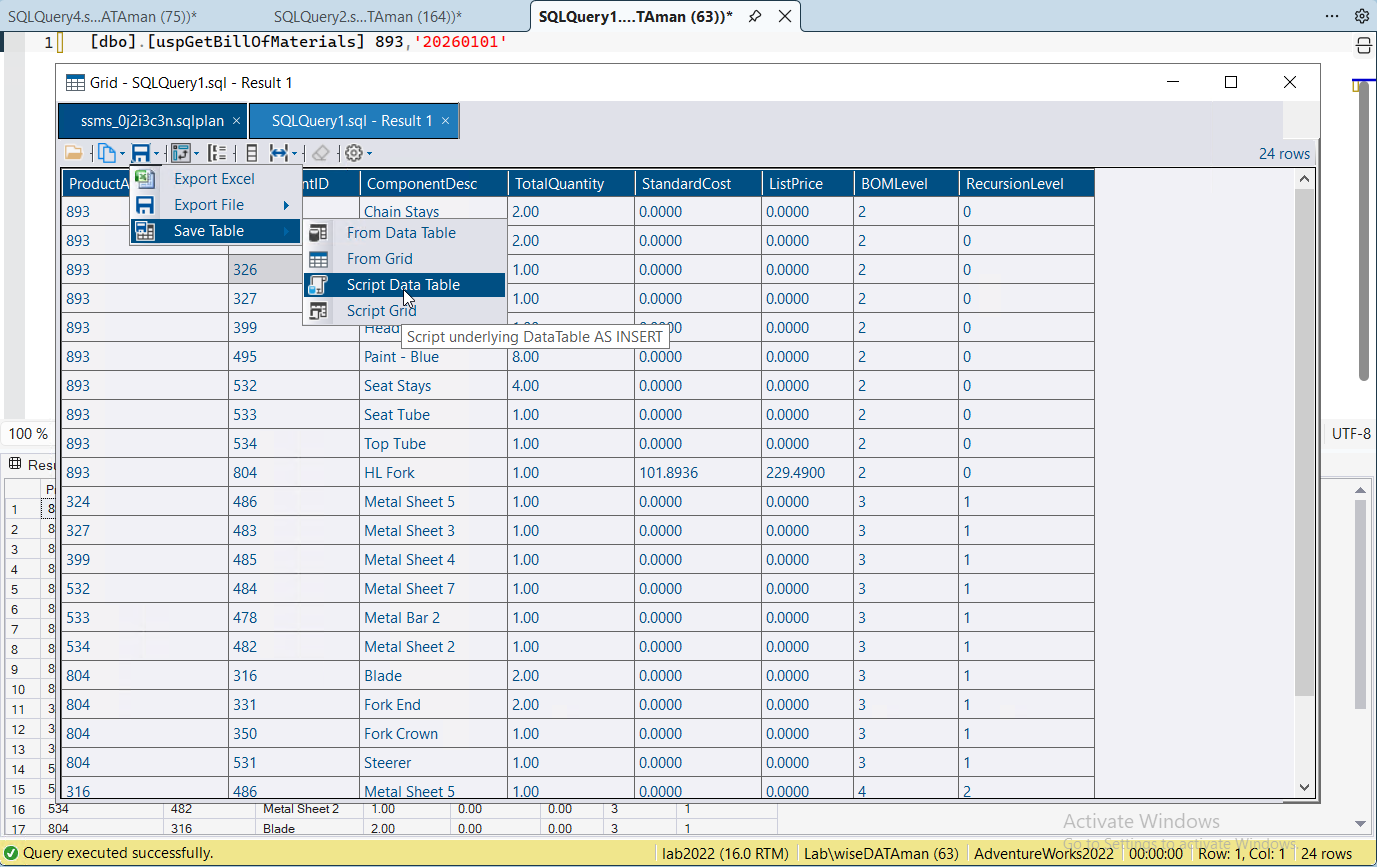
If the query window has more than one results grid, Open All Results in DBA Dash Visualizer sends every result set in one go. They open on a single tab with a table per result set. Save All saves them as a data set file that can be re-opened later, or as an Excel workbook with a sheet per result set. The Visualizer can also open results saved from SSMS with Save Results As XML.
You can also script the results as INSERT statements. Right-click the grid and select Save Table > Script Grid for the visible columns with their grid headers, or Script Data Table for all the underlying columns. The script creates a #DBADashGrid temp table, inserts the rows, and selects them back. Run it in SSMS to re-create the results you saw in the grid, then query the temp table to slice the data further. This is a handy way to share a result set with someone else or to keep a copy of it to compare against later. The grid can also save directly to a table in a SQL Server database, or export the data as JSON, XML, Markdown, HTML, or Excel.
The extension is included with DBA Dash and the Visualizer. Install or uninstall it from the Options menu in DBA Dash, or from the Settings menu in either viewer. You’ll be offered an update if the installed extension is older than the app.
See the SSMS Extension documentation for more detail.
Note: SSMS doesn’t provide a supported API for reading the plan, deadlock graph, or results grid data. The extension relies on SSMS internals, so a future SSMS update could break some of these options until the extension is updated.
DBA Dash also has a new Tools > Open Grid or Data Set option, which can open exported grids and the DataSets written to the DBA Dash service’s Failed folder without a repository connection.
Grids across DBA Dash, the viewers, and the Visualizer now support data bars for numeric columns. Right-click a column or cell and select Data Bar. A bar is drawn in each cell, sized by the value’s share of the column’s range, making it easy to spot the values that stand out.
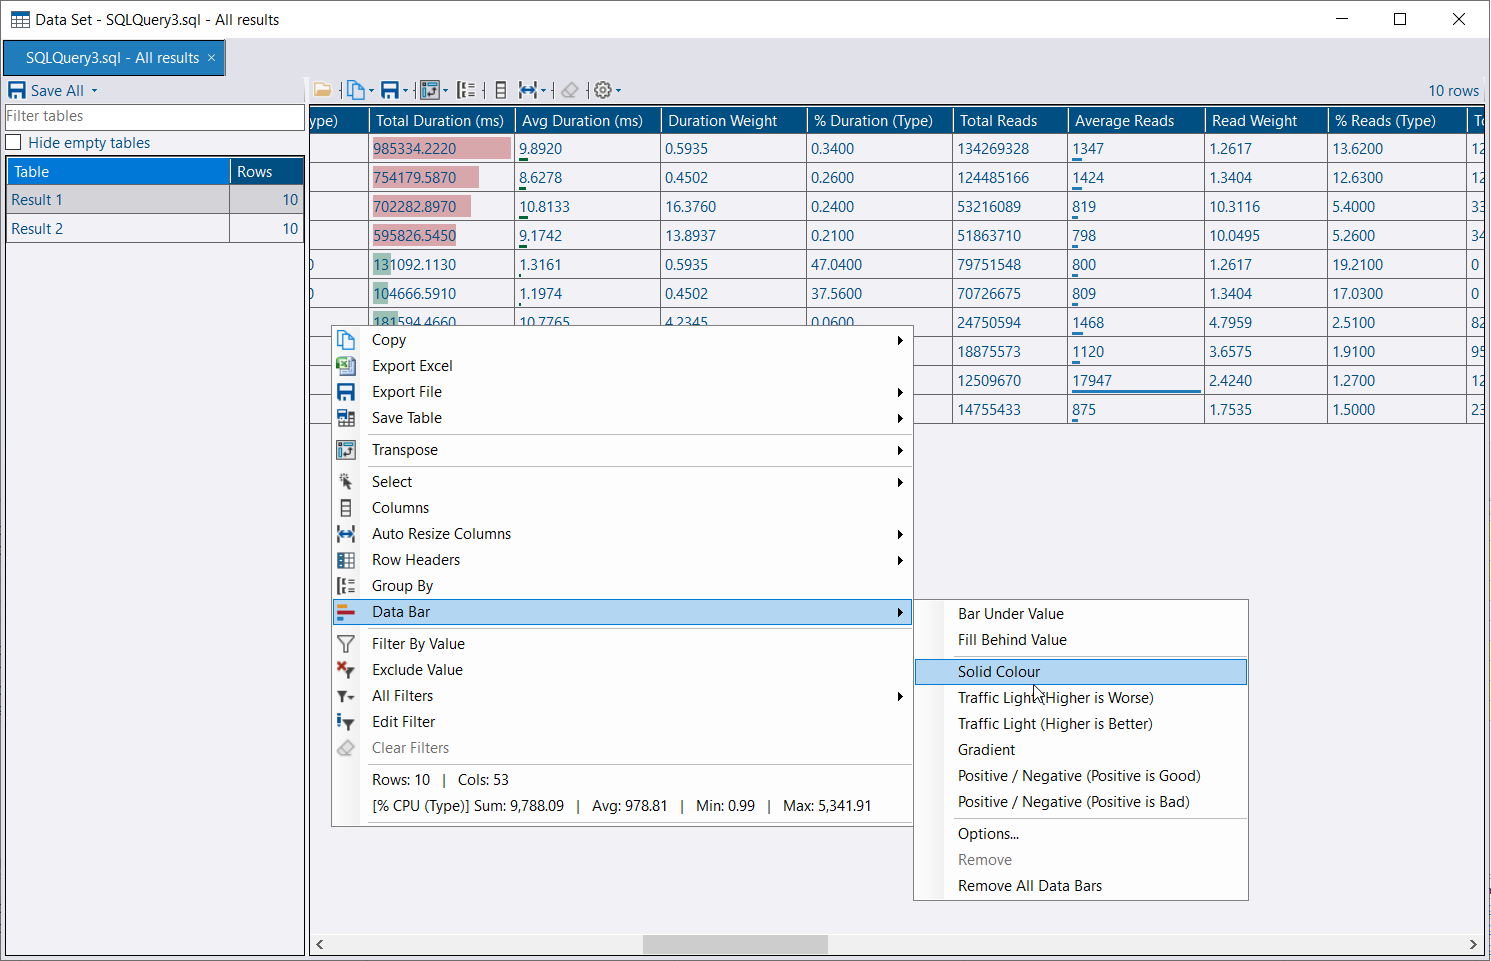
By default, a bar is scaled to the values showing, so it rescales when you filter, group, or refresh the grid.
Data bars can be saved with a custom report using Edit Report > Data Bar, or with Save Data Bars on the grid’s Data Bar menu. For result grids opened in the Visualizer, data bars are remembered and re-applied to the next result set with the same columns.
Thanks tao-exsitec for a bug fix contribution, and for an excellent bug report backed up with heap snapshots. ♥️
The offline instance monitoring added in 3.19.0 created a linked cancellation token source roughly once a second without disposing it, causing a slow memory leak in the DBA Dash service. In the reported case, the service grew by around 20 MB per day - from 3.2 GB to 6.8 GB over 184 days. If your service runs for long periods without a restart, upgrading to 4.20.4 is recommended.
See the release notes for a full list of fixes and improvements: