Title here
Summary here
November 16, 2026 in Releases by David Wiseman7 minutes

Insight cards and baseline lines on the Performance tab, baseline overlays on the Object Execution and Metrics charts, and a chart of running queries over time. Email a daily health summary of your instances, and see the DBA Dash service's own CPU, memory and work queue.
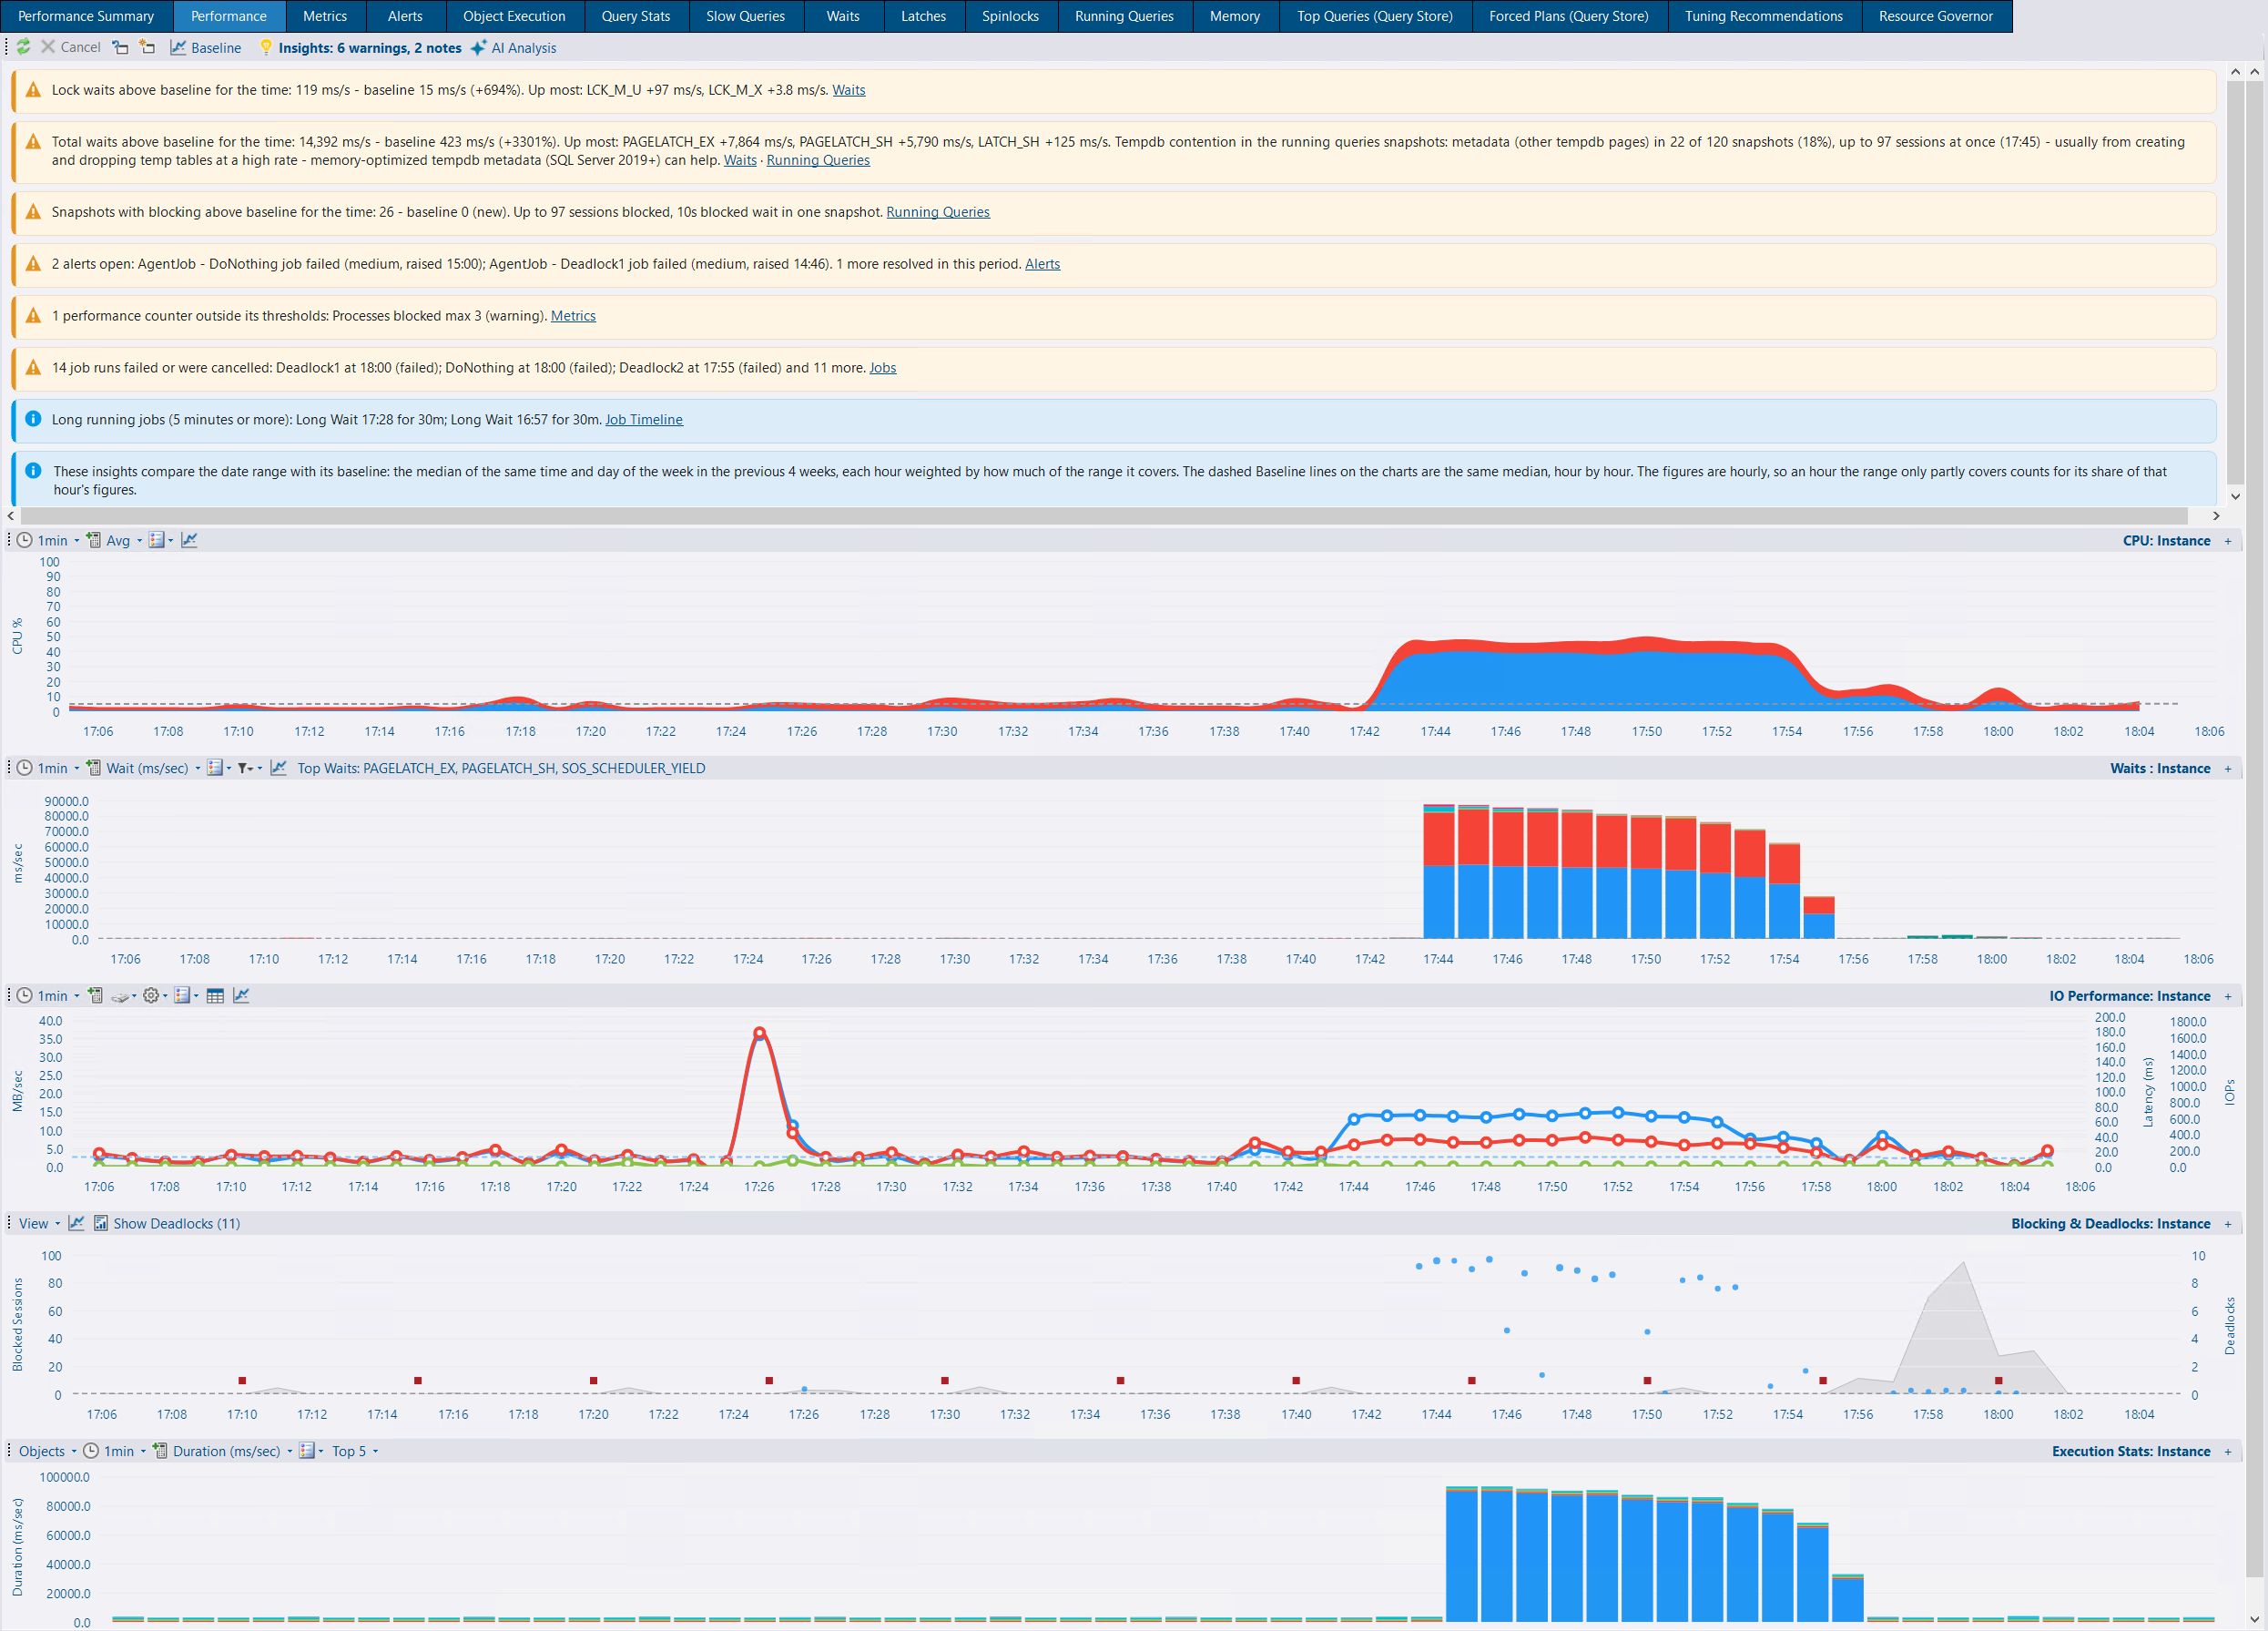
New insight cards show what’s over a Performance Summary threshold, or above baseline for the time of day and day of week, in the tab’s date range - plus what the charts don’t show: DBA Dash alerts, performance counters outside their thresholds, a restart or offline period, AG role changes, configuration/trace flag/patch/schema changes, failed and long running jobs, tempdb contention, and gaps in collection or collection errors. Cards link to the relevant tab or zoom the date range to the hour that matters, and start loading alongside the refresh without holding up the charts.
Baseline is the median of the same hours 1 to 4 weeks earlier. The CPU, Waits and instance-level IO charts get a dashed Baseline line (new toolbar icon, remembered per chart or toggled for all), and latency figures now show throughput alongside it, for example “at 1,200 IOPs, 45 MB/s (baseline 800 IOPs, 12 MB/s)”. At least 2 weeks of history are needed before anything is said to be above baseline.
The Insights toolbar button (lightbulb, as on Running Queries) shows the count of cards by severity and can hide or show them.

View > Lock Waits (on by default) shades LCK_* wait time behind the blocking and deadlock markers on the blocking chart, with its own baseline line for the same hours in previous weeks. This makes short, frequent blocking more visible, even when it’s only captured occasionally in the running query snapshots. Wait stats are instance wide, so at database level the series is labelled (Instance). See Performance tab.

The execution stats chart has a new Objects/Queries toggle. Queries shows the top statements over time from the Query Stats tab’s data. Note: query stats are collected every 5 minutes by default, so there will be fewer bars than for object execution stats, which are collected every minute by default.
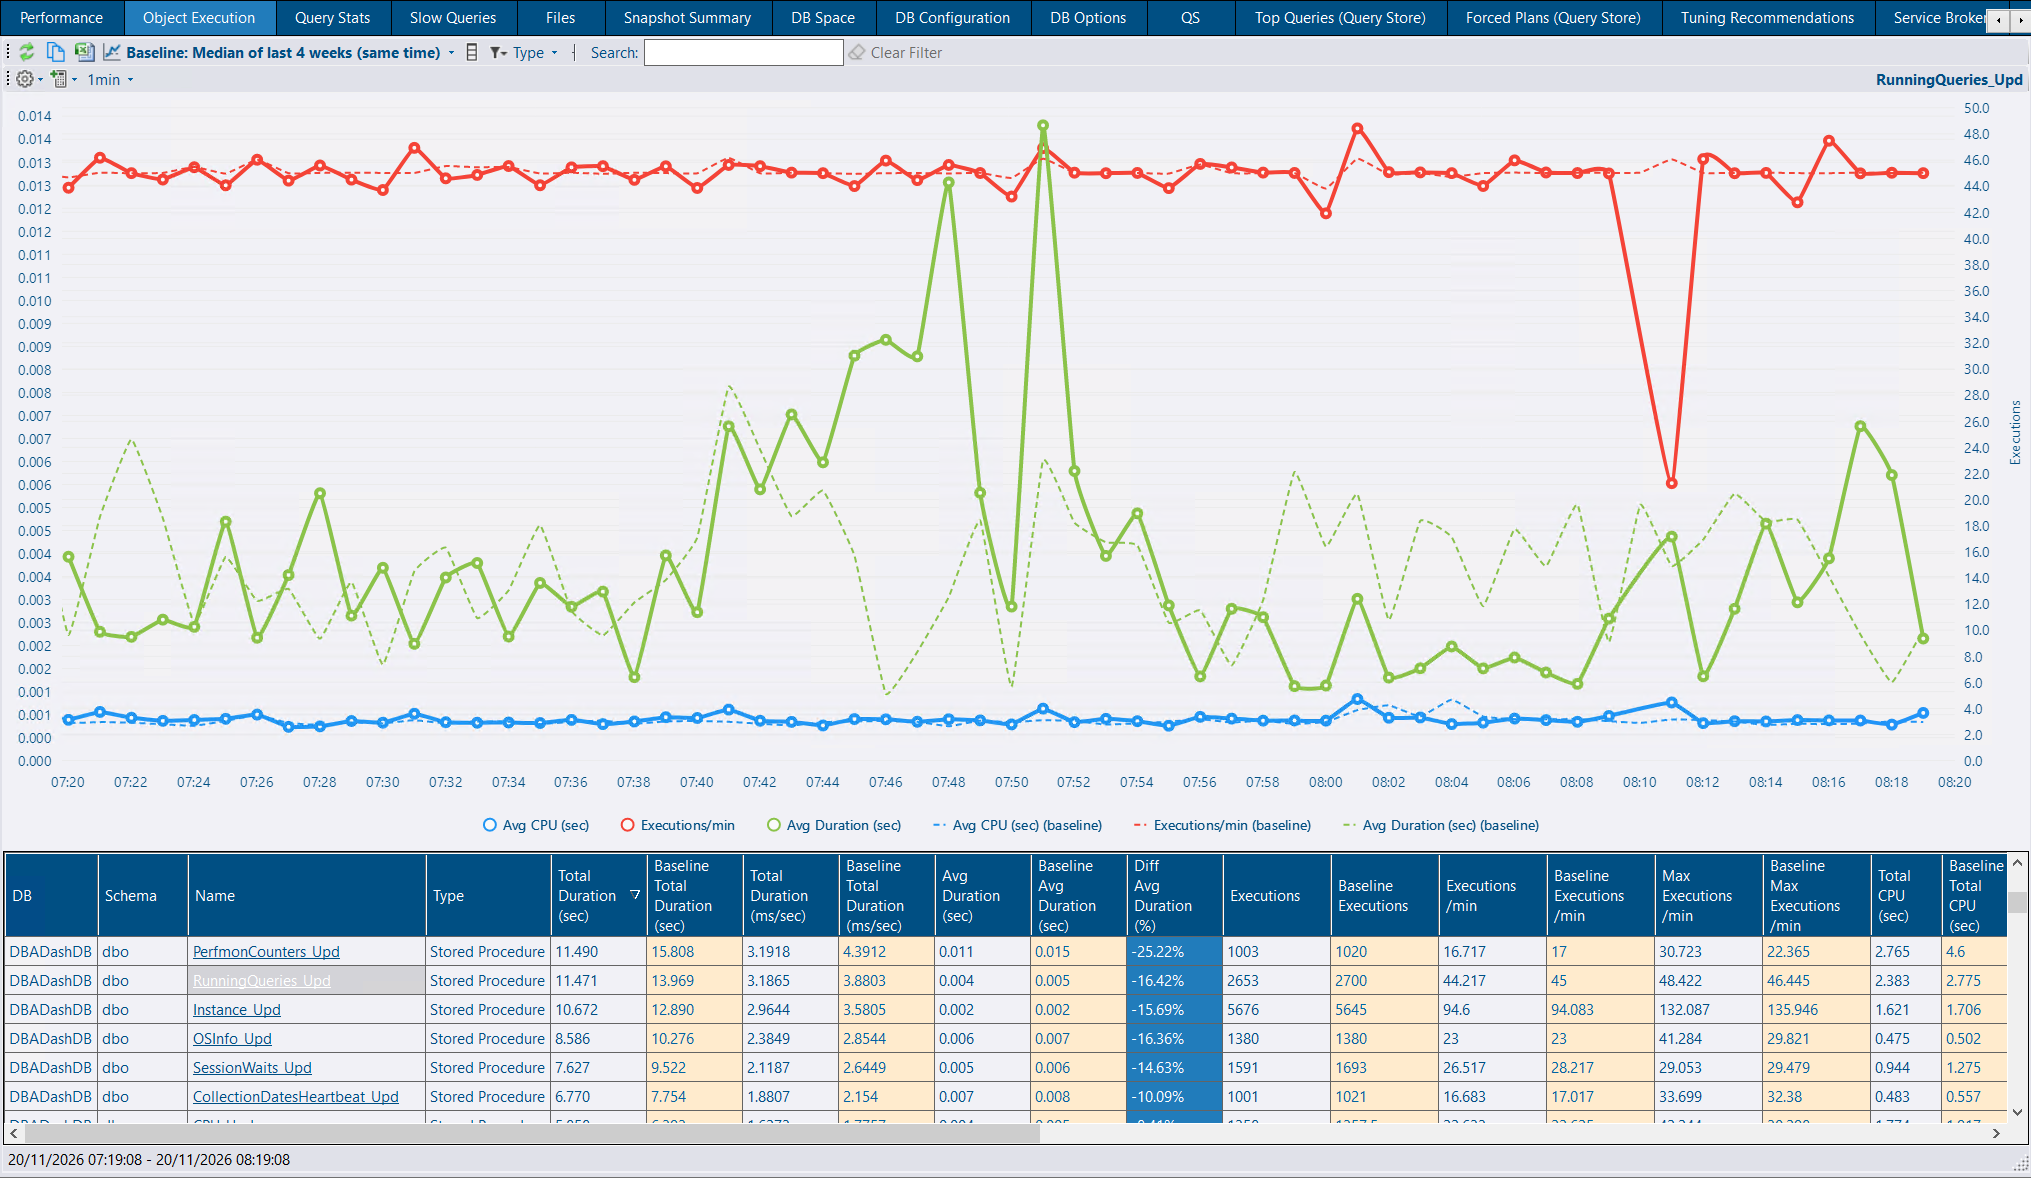
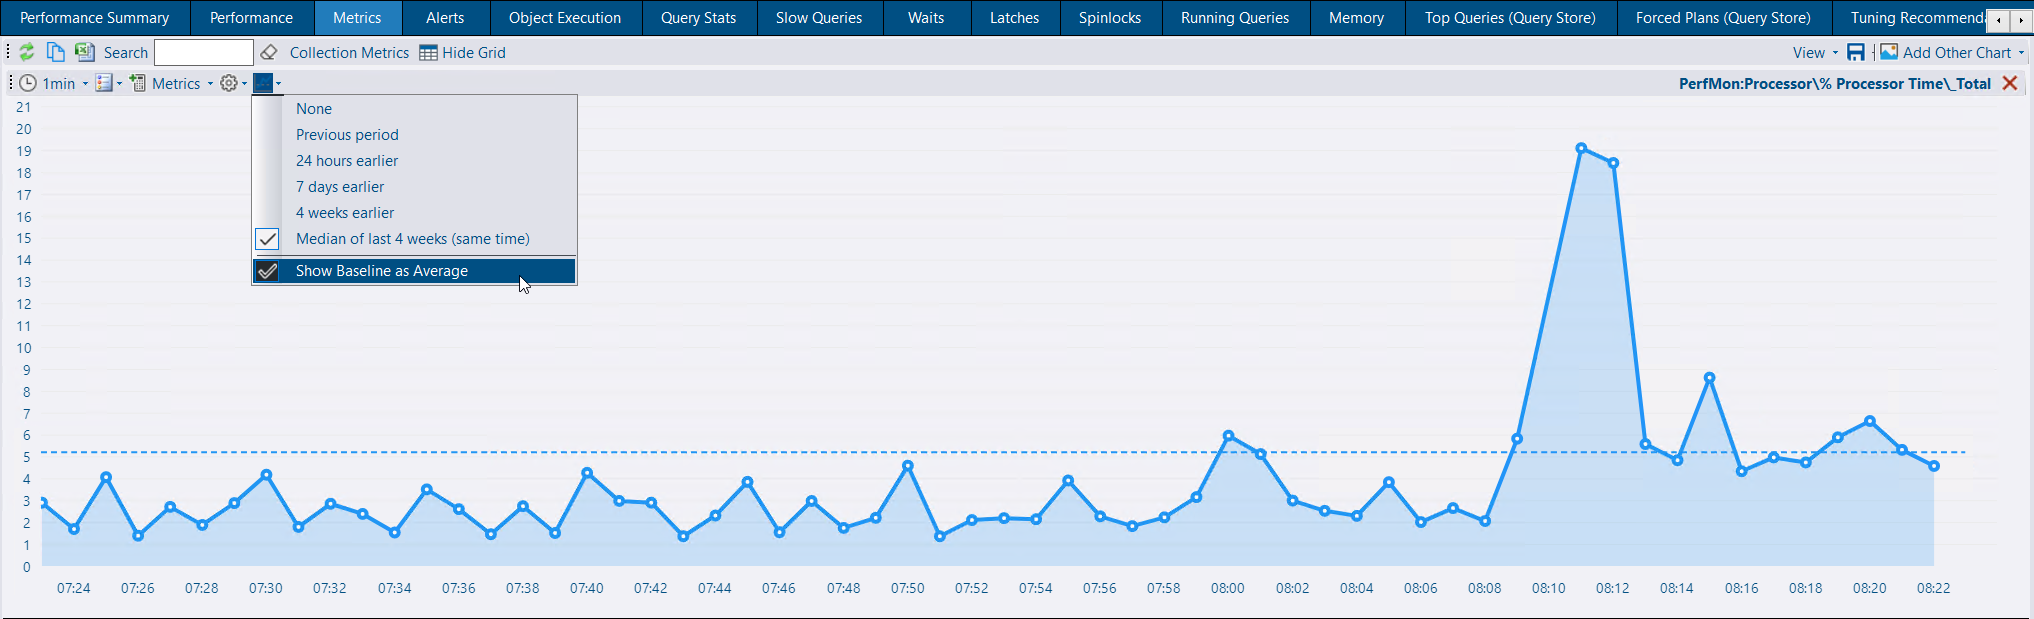
The Object Execution chart and each Metrics chart can now draw a baseline on the same chart, as dashed lines in each series’ colour, shifted to line up with the period viewed. The Baseline menu chooses which baseline to use: the previous period, 24 hours, 7 days or 4 weeks earlier, or the median of the same time in the last 4 weeks. Show Baseline as Average draws each series’ average over the baseline period as a flat dashed line instead. This replaces the separate comparison chart, whose scales didn’t match.
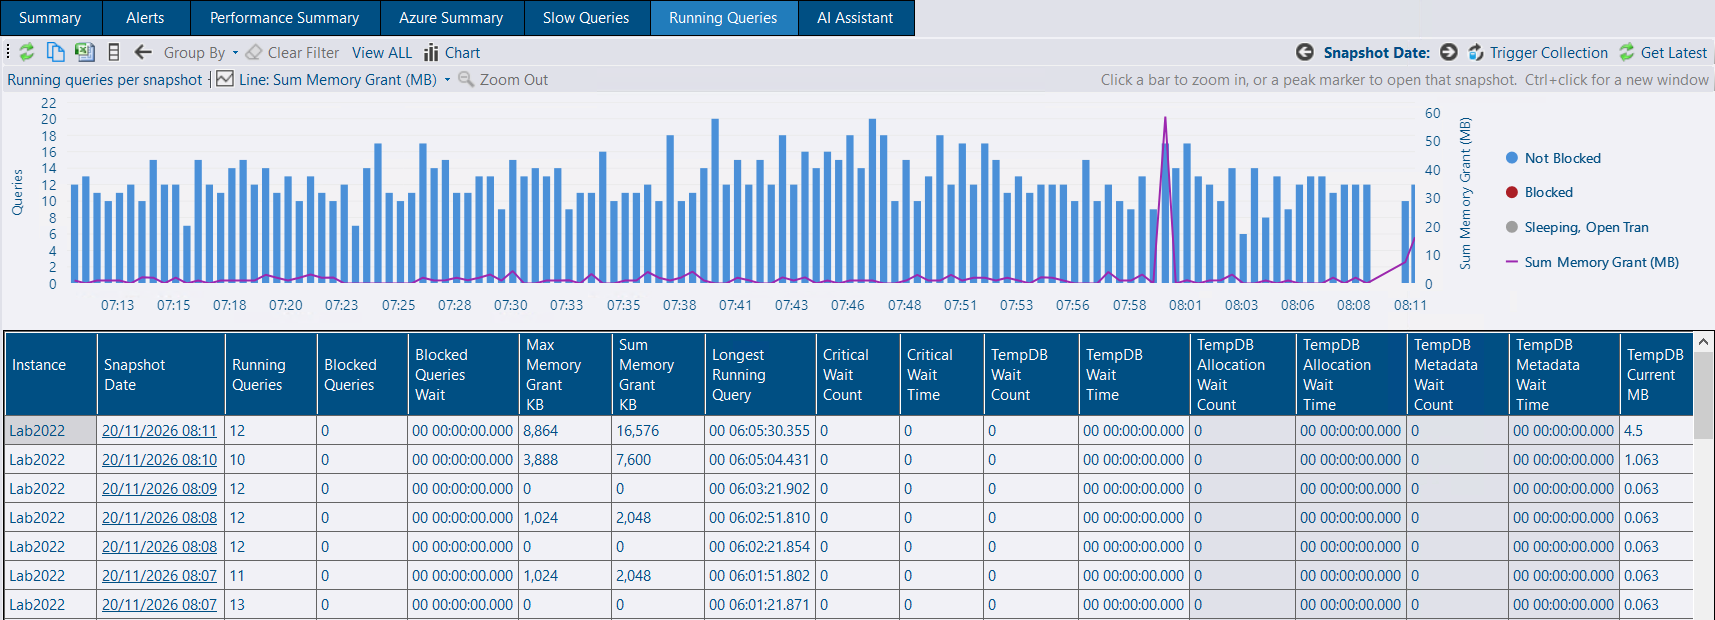
An instance’s Running Queries summary view now has a stacked bar chart above the list of snapshots: not blocked, blocked (red) and sleeping with an open transaction (grey). When the range has more snapshots than fit, they’re grouped into time buckets - each bar is the average over its snapshots, with a diamond marking the busiest snapshot so short spikes aren’t averaged away.
Click a bucket to zoom the chart and the snapshot list into it, down to one bar per snapshot. Click a snapshot’s bar or a peak marker to load that snapshot (Ctrl+click opens it in a new window). Zoom Out or Back returns to the previous range. An optional line on a second axis shows sum or max memory grant, tempdb/blocked/critical wait time, longest running query, oldest transaction or tempdb current MB, using the max per bar. See Running Queries.
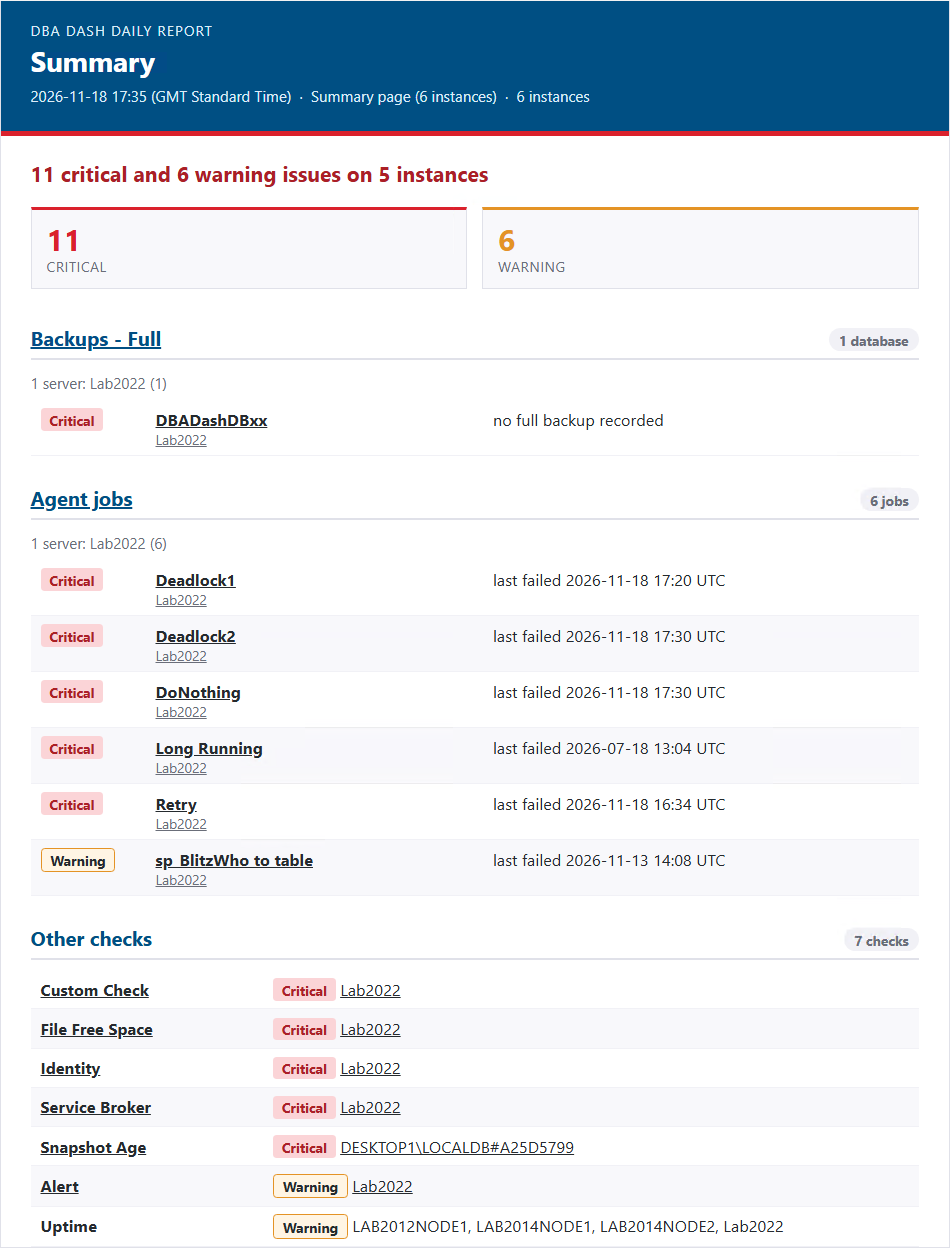
DBA Dash can now email a daily health summary of your instances, on a schedule you choose. Manage reports from Alerts > Daily Reports, scoped to all instances or chosen tags.
The Summary page also has a new Report toggle that shows the same layout in the app, with links to the matching tabs. See Daily Reports for more information.
Email notification channels each carried their own SMTP settings, so every new channel repeated the host, port, credentials and from address. These now live in Email Servers (new toolbar icon on the Alerts page), which email channels and daily reports select - a channel or report only holds its recipients. The email channel has a server dropdown with New server… to create one, and a server can’t be deleted while it’s in use.
On upgrade, each existing email channel gets a server with its current settings. See Email Servers.
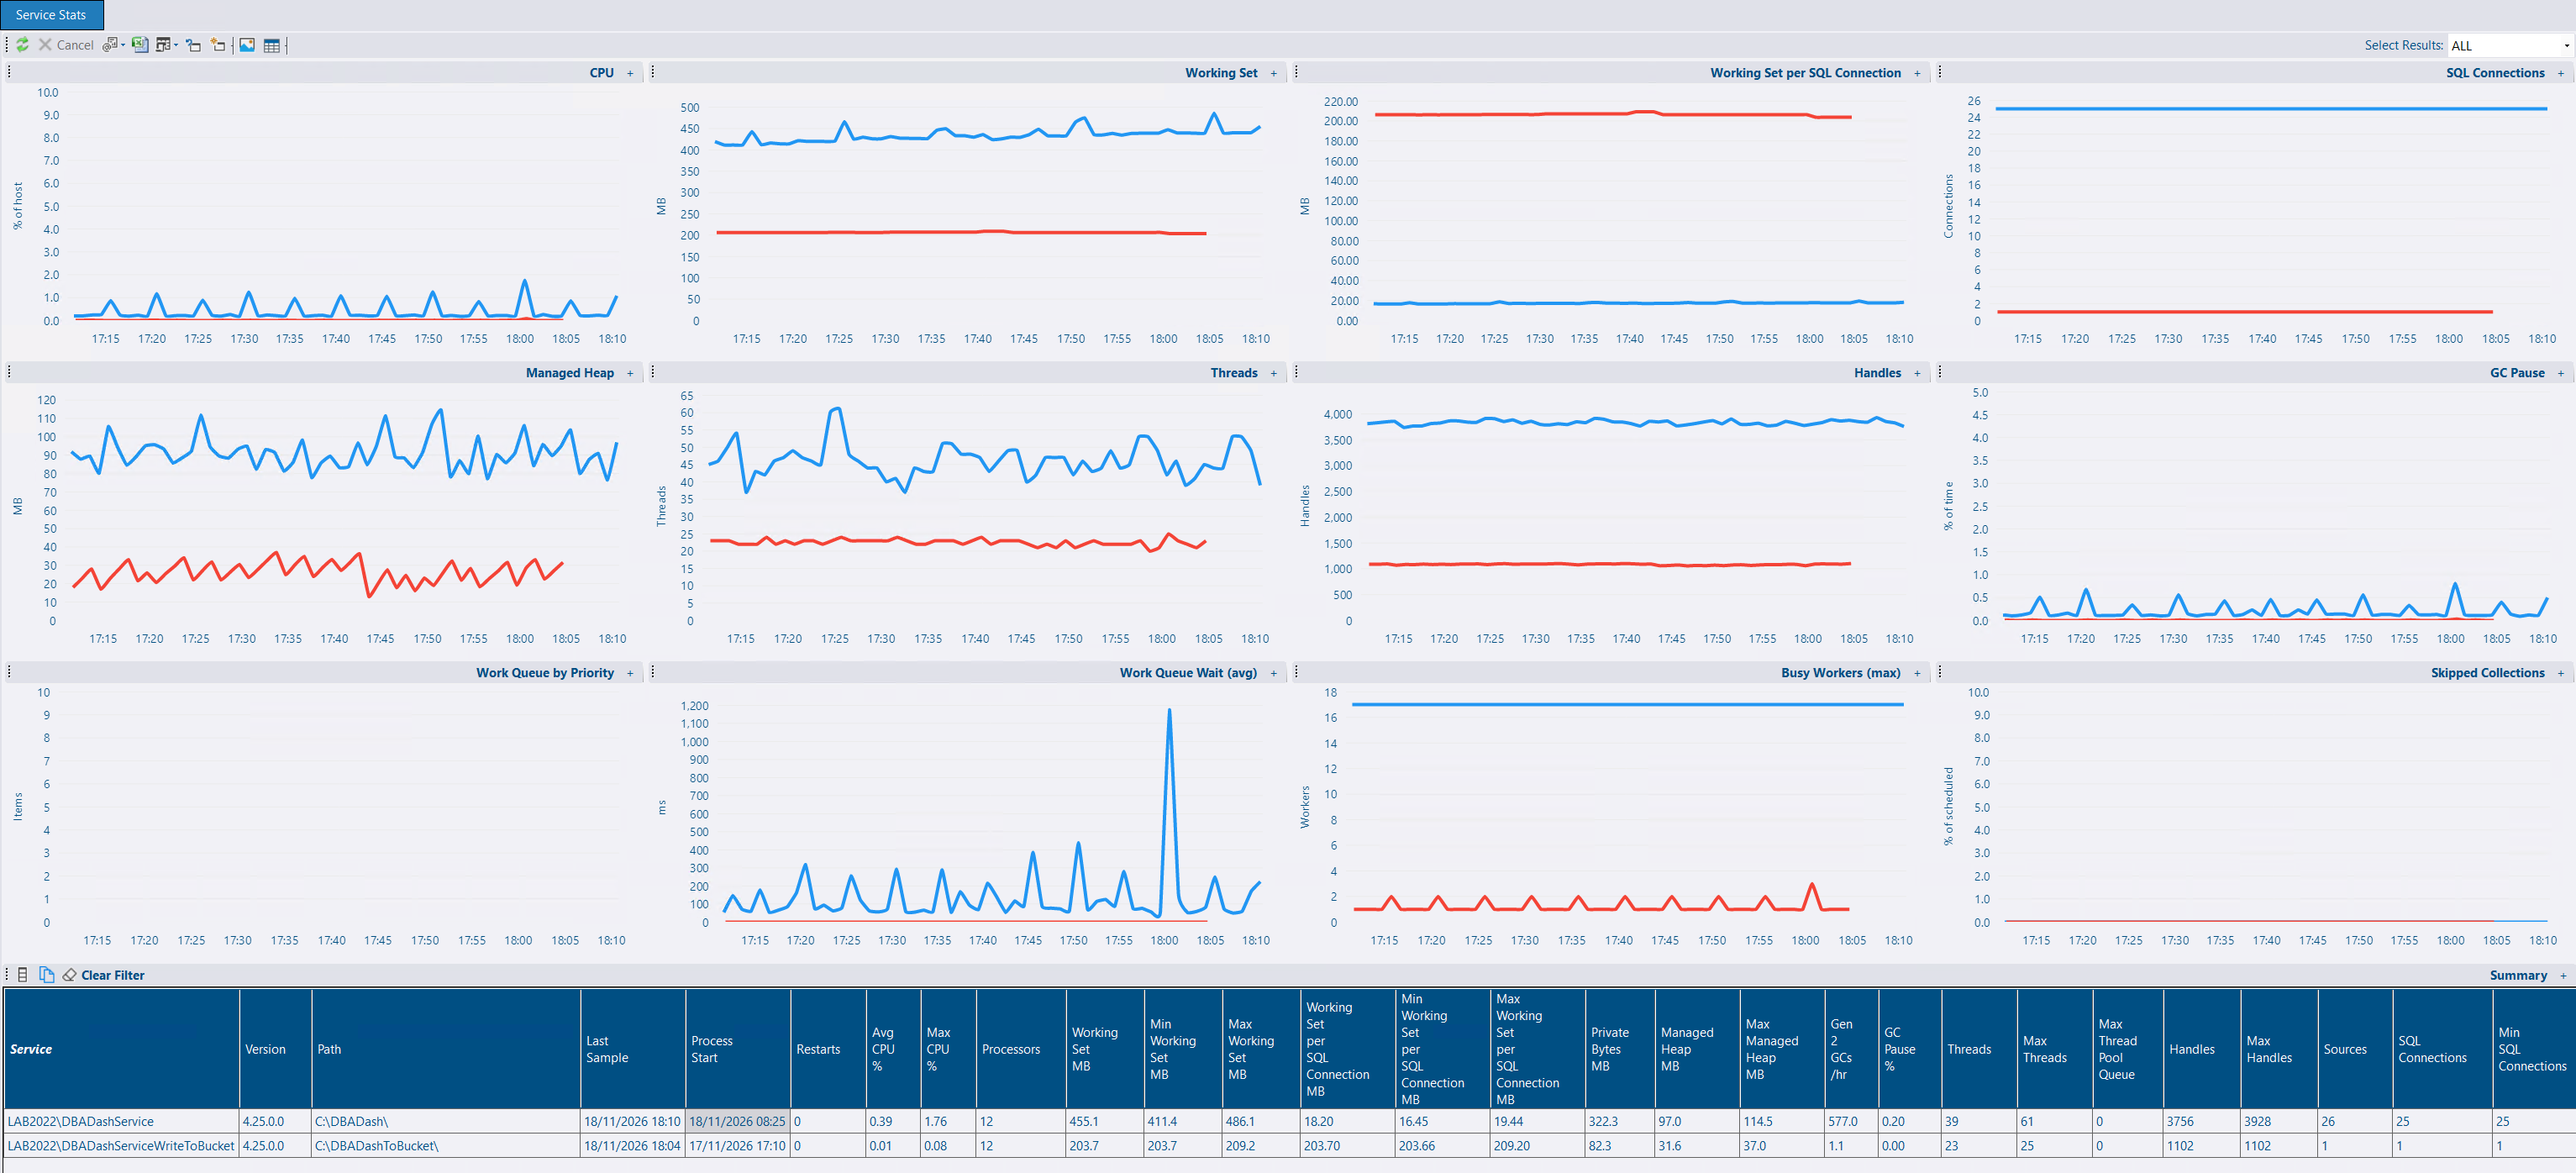
The DBA Dash service now samples its own resource usage - CPU, memory, GC, threads, handles, collection work queue and source connection counts - and reports it to the repository, with no extra queries against your monitored instances. It’s collected once Log Internal Performance Counters is turned on. A new Service Stats system report shows a summary row per service (current, min/max/avg and rates) and 12 over-time charts, scoped to the services that collect or import the instances in context. See Log Internal Performance Counters.
DBA Dash Visualizer opens JSON lines files (.jsonl, .ndjson) as a grid, with a column per property, and lays out Serilog compact (.clef) logs as a log: Timestamp, Level, Message, Exception, then properties. Records that can’t be read (such as a half-written last line) don’t stop the file opening, and a log that’s still being written can be viewed.
DBA Dash Visualizer is a separate app, but DBA Dash itself has the same features, so you can use either to open JSON files as a grid with many options for filtering, grouping and export. The next version of DBA Dash will switch from text-based logs to JSON, and DBA Dash Visualizer is the perfect tool to view these log files.
See DBA Dash Visualizer.
.xml.gz files instead of .xml, off by default. The failed message folder is capped at 1000 files, so a repository that keeps rejecting imports no longer fills the disk. See Destination Connection.ObjectDisposedException every time it was activated, from a removed insight card keeping focus (#2315, 4.26.1).See the release notes on GitHub for the full list: