Title here
Summary here
Collection Health is available from 4.25.0.
The DBA Dash service reports every collection run to the repository. Collection Health shows whether your collections are working, how much they cost, and how long their data waits before it’s imported.
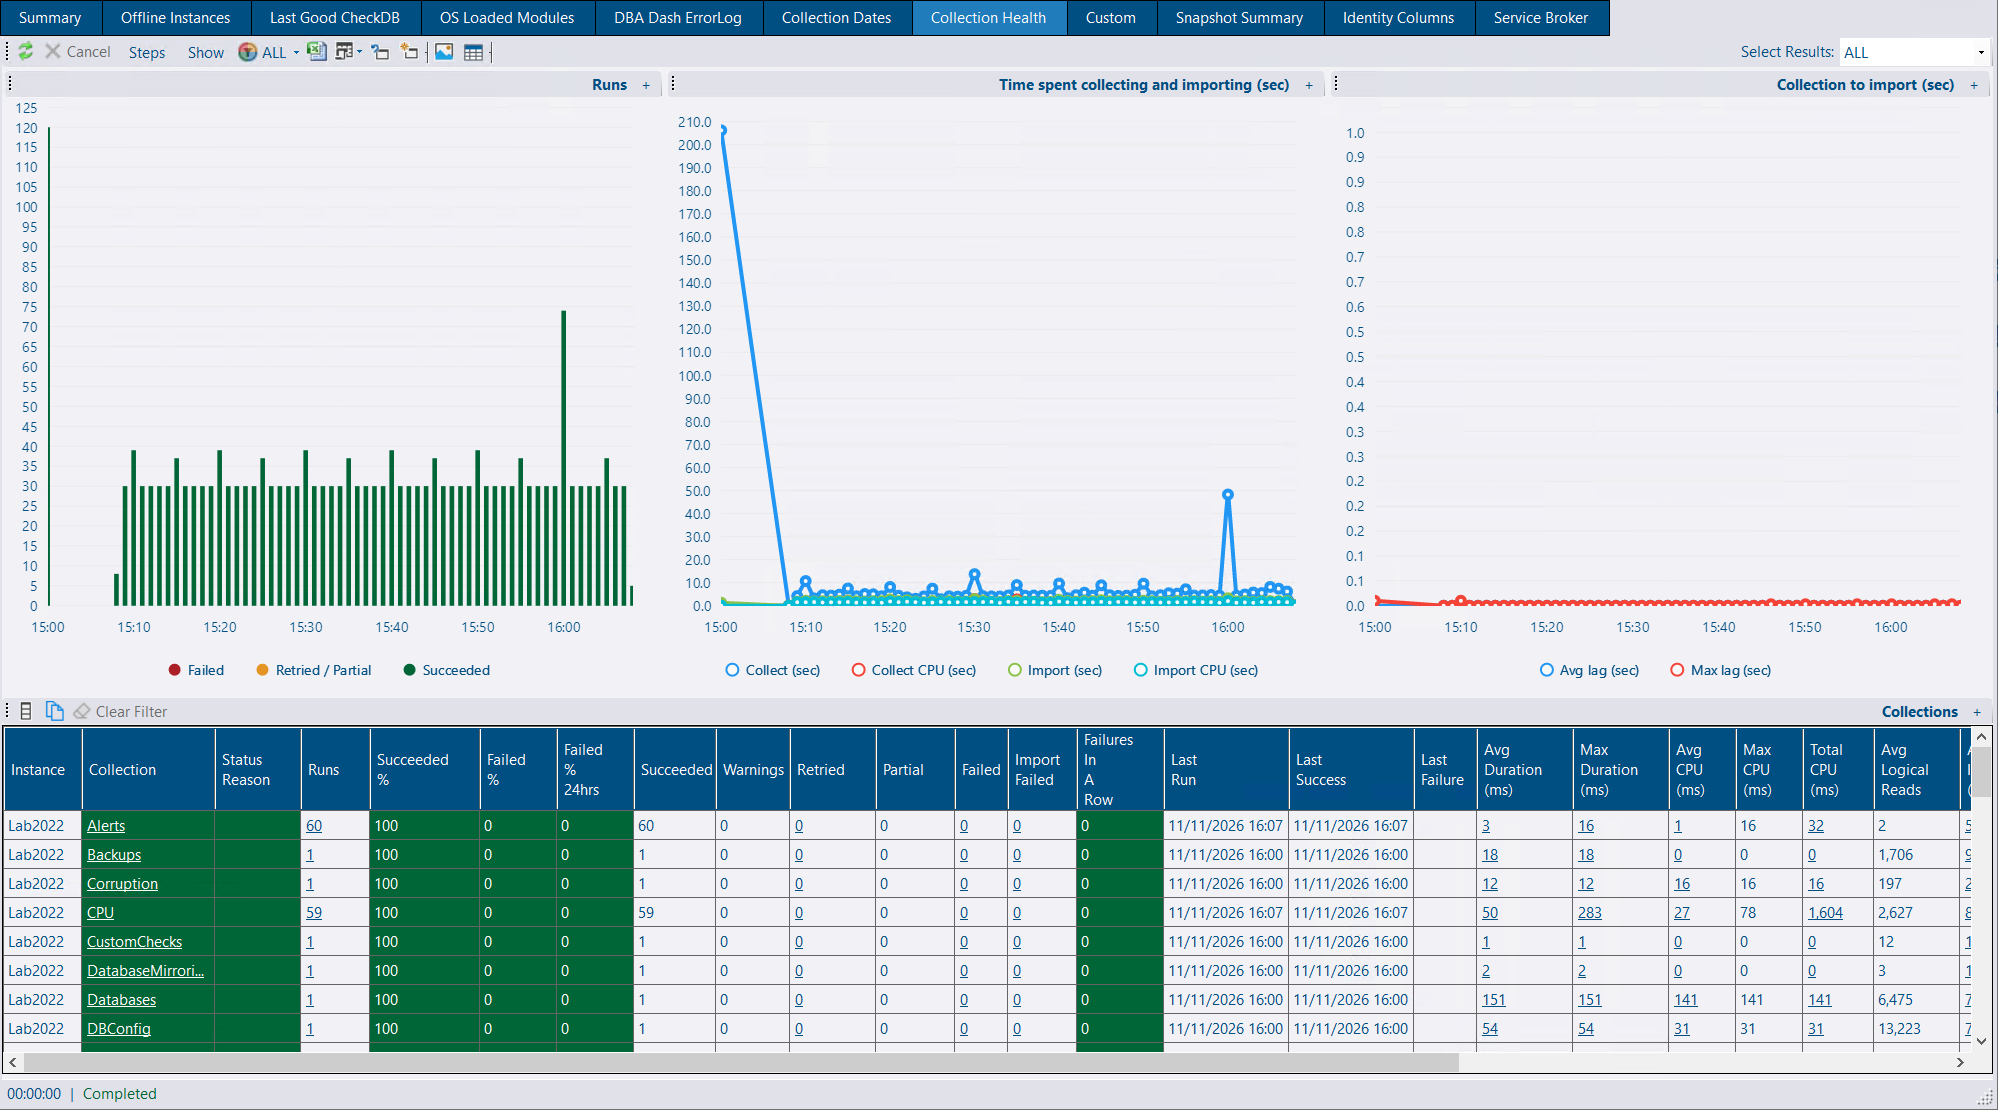
DBA Dash checks collections in two ways, and both are shown on the Summary tab:
| Check | Summary column | Tab | What it catches |
|---|---|---|---|
| Collection Health | Collection Health | Collection Health | Collections that run but fail, partly fail or fail to import |
| Collection Dates | Snapshot Age | Collection Dates | Collections that haven’t run within the expected time |
Collection Health can only report on runs that happen. If a collection stops running altogether - the service is stopped, an instance has been removed from the service config, or a schedule is broken - there are no failed runs to report. Snapshot Age catches this. It highlights a collection whose last run is older than its threshold.
On the Collection Dates tab under the Checks node, a collection with no threshold set uses one based on its schedule: warning at twice the longest interval between runs plus 3 minutes, and critical at 4 times the interval plus 6 minutes. You can set your own thresholds for all instances or for one instance. See Collection Thresholds.
Use both: Snapshot Age tells you a collection has stopped, and Collection Health tells you a collection is running but not working.
Each collection run is recorded with one of these outcomes:
| Outcome | Meaning |
|---|---|
| Succeeded | The collection ran without errors. |
| Warning | The collection succeeded, but logged a warning. |
| Retried | The collection succeeded after one or more attempts failed. |
| Partial | Part of the collection logged an error, but it still collected some data. For example, one WMI query out of several failed. |
| Failed | The collection logged an error and collected no data. |
| Import Failed | The data was collected, but a table failed to import into the repository. |
Some collections have steps that run after them, such as collecting query text and plans for running queries and query stats. These steps are recorded as runs of their own.
The report shows a row per collection per instance, or a row per collection across all the selected instances. It can include or leave out the steps that follow some collections. Columns include:
Hover over a column heading to see which period it covers. Failures in a row show the current state, whatever period is selected. A weekly collection that failed at the weekend still shows as failing over the last hour.
Charts show runs by outcome, cost and import lag over time. Where each run is kept (see Cost), the charts go down to 5 minute buckets.
The counts link to the errors behind them. Errors, Failed and Import Failed leave out retries, and Retried includes them. Last Failure links to the errors for that failure, whatever period is selected.
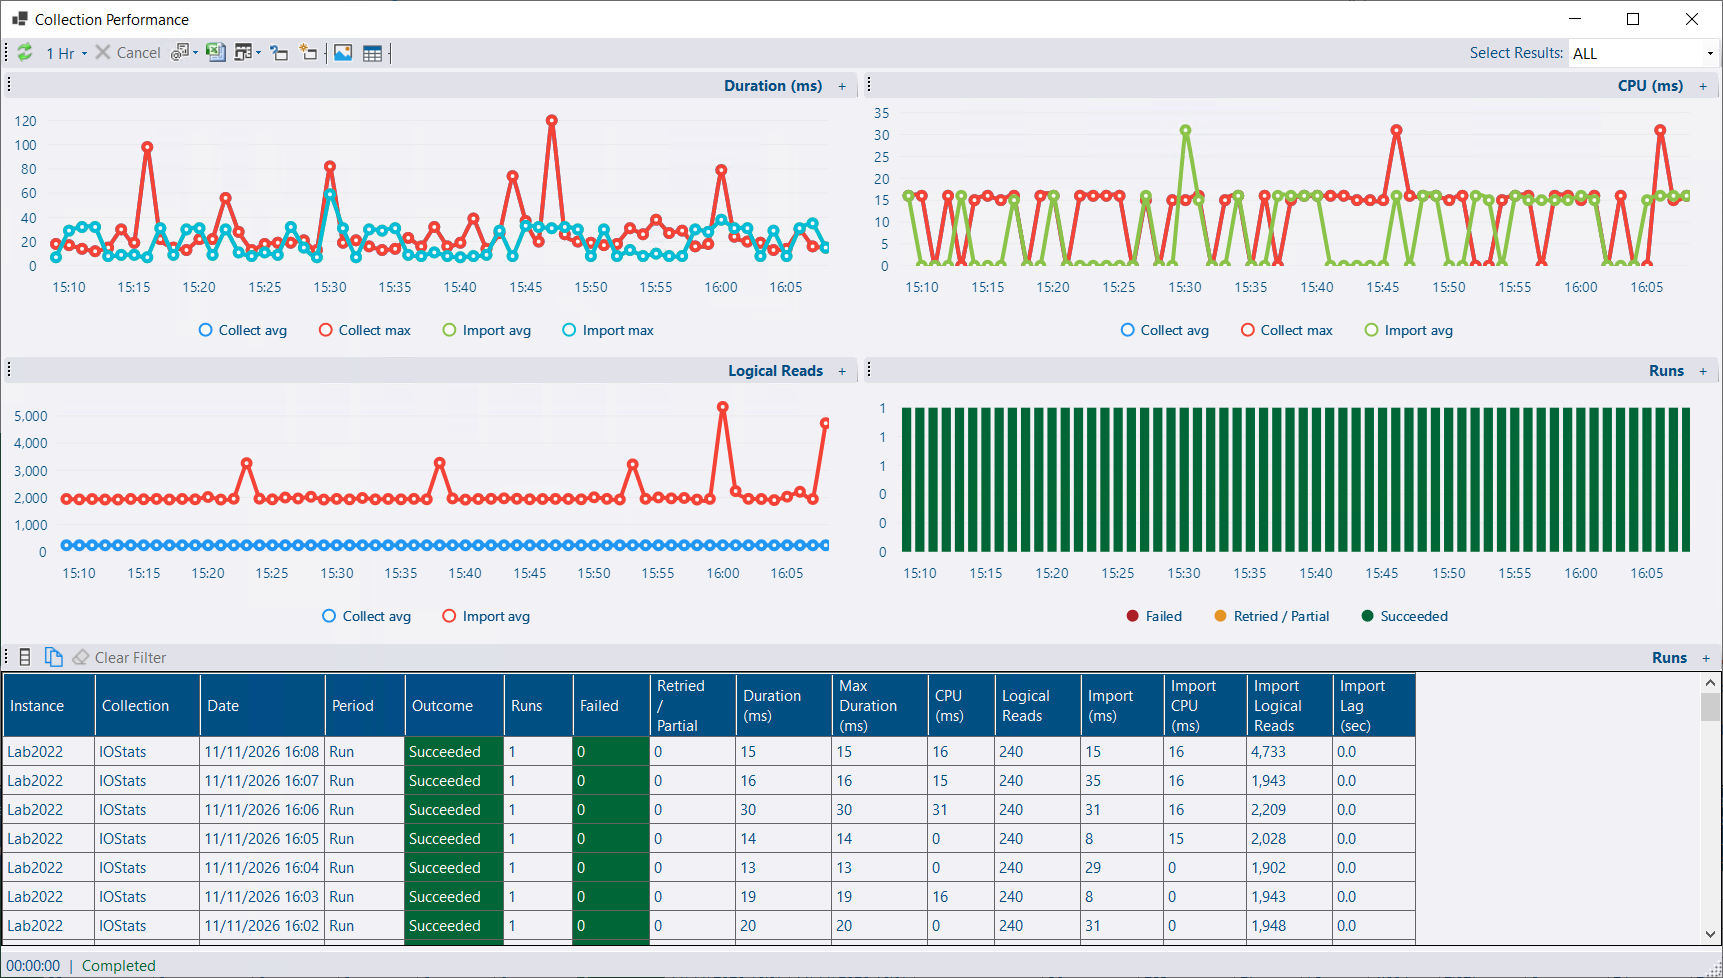
Click a collection to open a Collection Performance report, which shows each run (or each hour) for that collection over time.
A collection’s status is OK, Warning or Critical. Two things can raise it.
Failures in a row only raise a status when they reach both a number of failed runs and a time since the last success:
| Status | Failed runs | Time since last success |
|---|---|---|
| Warning | 1 | 10 minutes |
| Critical | 3 | 30 minutes |
A collection that runs every minute has to keep failing for 10 minutes before it shows. A collection that runs daily shows on its first failure. If a collection has never succeeded, only the number of failed runs is used.
The failure rate is used when there are at least 5 runs:
| Status | Failure rate |
|---|---|
| Warning | 10% of runs failed or partly failed |
| Critical | 50% of runs failed, and the latest run failed |
A collection that has recovered is a warning at most. On the Summary tab, the failure rate covers the time since errors were last acknowledged, up to 24 hours.
Click the Thresholds column to change the thresholds. They can be set for:
The most specific setting wins, one threshold at a time. Anything not set uses the defaults above. Select Don’t monitor to stop a collection affecting the status.
Paused instances and disabled schedules show as N/A.
Acknowledge Errors on the DBA Dash ErrorLog toolbar clears failures in a row until the next failure.
Instances whose DBA Dash service is older than 4.25 don’t report collection runs. For those, the Summary tab counts collection and import errors in the last 24 hours, as before.
Turn on Log Internal Performance Counters in the service config tool to record cost. With it on:
Without it, only the hourly rollup is kept, CPU and logical reads aren’t recorded, and the charts use hourly averages.
On the monitored instance, DBA Dash reads its own connection’s cpu_time and logical_reads from sys.dm_exec_sessions when a collection finishes. A connection starts with these counters at zero, including a pooled connection, which is reset when it’s reused, so they show what the collection used. A connection can always see its own session, so no extra permissions are needed. It costs one small query per connection, and it only runs with Log Internal Performance Counters on.
Collections that don’t use a SQL connection, such as WMI, report no CPU rather than zero.
In the repository, the importer measures each table it imports the same way and adds the cost to the collection run the table belongs to.
Import lag is the time from the service handing a batch of collected data to its destination to the import starting.
Collection Health data is also available as DBA Dash counters:
| Counter | Description |
|---|---|
| Collection Duration (ms) | Time to run the collection |
| Collection CPU (ms) | CPU used on the monitored instance |
| Collection Logical Reads | Logical reads on the monitored instance |
| Collection Failed | 1 for a failed run, 0 otherwise. Its average is the failure rate |
| Collection Import Duration (ms) | Time to import into the repository |
| Collection Import CPU (ms) | CPU used in the repository |
| Collection Import Logical Reads | Logical reads in the repository |
| Collection Import Lag (ms) | See Import lag |
These can be charted and used in alert rules like any other counter. On the Metrics tab they’re hidden by default. Click Collection Metrics to show them. Collection Duration (ms) keeps the same CounterID it had before 4.25, so existing alert rules on it carry on working.

The DBA Dash ErrorLog tab under the Checks node lists the errors behind Collection Health. It opens on a row per instance, or a row per source when one instance is selected. The counts are split two ways:
Click an instance, a source or a count to narrow the report, and Back to go up again.
When 2 or more collections on an instance fail with WMI errors, WMI is probably not working on that instance at all. Collection Health and the ErrorLog show a card suggesting that you fix WMI access, or select No WMI for the instance on the Source tab of the service config tool. See WMI.
| Table | Contents | Default retention |
|---|---|---|
dbo.CollectionRuns | Each run (only with Log Internal Performance Counters on) | 30 days |
dbo.CollectionRuns_60MIN | Hourly rollup | 365 days |
See Data retention to change these.