Title here
Summary here
Deadlock collection is available in DBA Dash starting from 4.18.0.
DBA Dash captures deadlock graphs from an extended events session on each monitored instance, shreds them into the repository database, and groups recurrences together so that a deadlock happening two hundred times reads as one problem rather than two hundred incidents.
The Deadlocks collection is scheduled to run every 5 minutes by default, but it doesn’t collect anything until you choose a capture option for each monitored instance.
master database is excluded - it has no user workload to deadlock and can’t hold a database scoped session.| Capture option | Permission required on the monitored instance |
|---|---|
| Dedicated system managed session | ALTER ANY EVENT SESSION (the same permission slow query capture already needs), plus VIEW SERVER STATE |
system_health | VIEW SERVER STATE |
| Existing session | VIEW SERVER STATE |
DBA Dash only ever creates, alters, resizes or flushes the session it owns (DBADash_Deadlocks). Any other session - including system_health - is read and left alone. It is never started, stopped or modified.
See the security document and the permissions helper in the service config tool.
Deadlock capture is controlled by a single setting: the name of the extended events session to read. A blank name disables the collection. There is no separate on/off switch to get out of step with it.
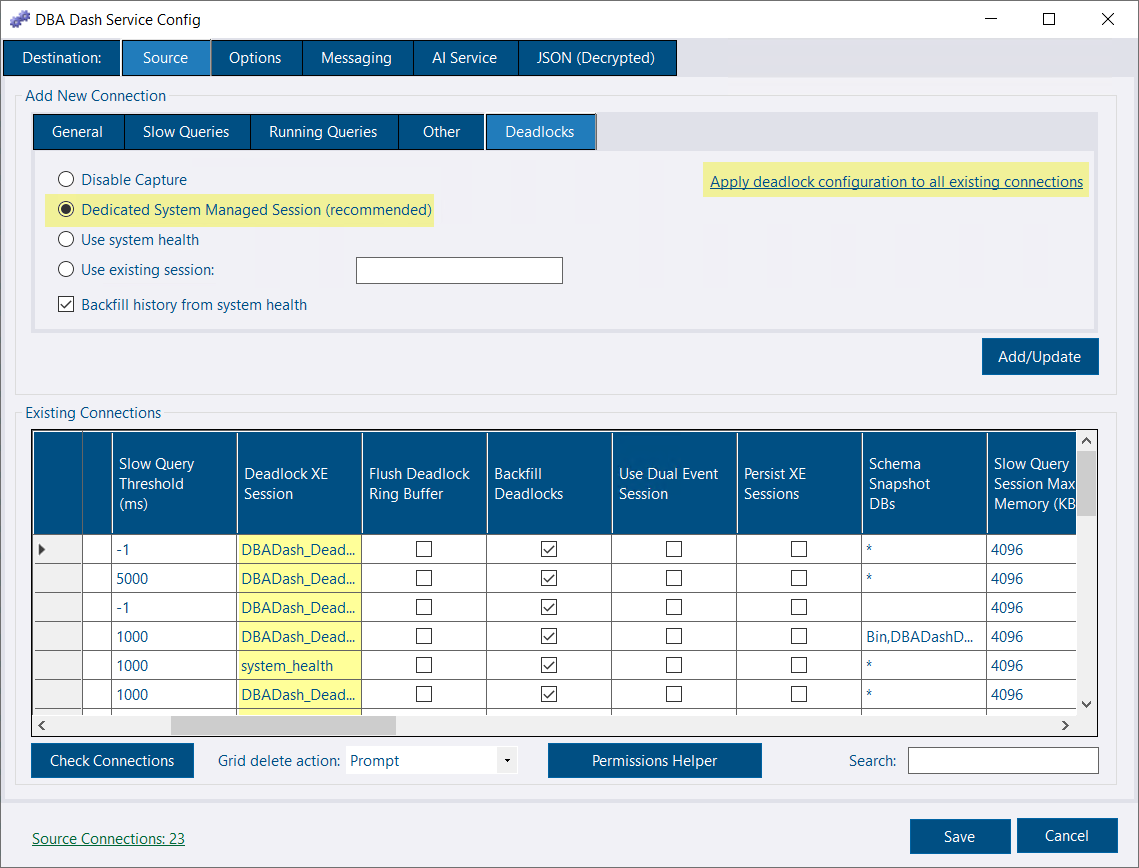
| Option | Session name written to the config | Notes |
|---|---|---|
| Disable Capture | (blank) | The default. The collection doesn’t run whatever its schedule says. |
| Dedicated System Managed Session | DBADash_Deadlocks | Recommended. DBA Dash creates and starts the session itself and reads only it. |
| Use system health | system_health | Nothing to deploy, read only, and it already contains recent deadlocks - but less efficient to read because unrelated events must be processed. Not available on Azure SQL Database. |
| Use existing session | your session name | A session you already run. Read only - if it isn’t running that is reported as an error rather than started. Ideally it should contain only the sqlserver.xml_deadlock_report event. |
Prefer the dedicated system managed session. Each collection only reads events that are new since the last run, but system_health captures many other kinds of event besides deadlocks, and all of them have to be read and filtered out to find the deadlock reports. A session containing nothing but deadlock reports has nothing else to process, so reading it is much cheaper on every collection.
What a dedicated session gives up is history - it starts empty. The Backfill history from system health option covers that; see Backfill below.
There are two ways to configure instances you have already added:
DBADash_Deadlocks (recommended), system_health, or your own session name. Clear it to disable capture. The Backfill Deadlocks column controls the backfill.Applying system_health to all connections skips Azure SQL Database instances - there is no system_health session there. Any instance whose platform can’t be determined at the time is skipped and reported rather than being assigned a session that might not exist.
The Deadlocks collection runs every 5 minutes by default. No schedule change is needed - choosing a capture option is all it takes to start collecting.
The schedule can be adjusted like any other collection:
If the Deadlocks schedule has been cleared (for the service or for the connection), the config tool warns when you enable capture and offers to restore the default 5 minute schedule - a session with no schedule would collect nothing.
See Schedule for cron expression syntax.
A dedicated session starts empty. With Backfill history from system health enabled (the default), DBA Dash reads system_health once, after the first Deadlocks run for that connection, to pick up deadlocks from before the session was created.
DeadlockCursors.json, where the backfill is recorded as pending until it has run. A service restart before it runs doesn’t lose it. Losing that file repeats the backfill once - the repository deduplicates what comes back.system_health, or the instance is Azure SQL Database.These are set in ServiceConfig.json (see Config File) and apply to the whole service rather than to one connection:
| Setting | Default | Description |
|---|---|---|
DeadlockXERingBufferKB | 1024 | Size of the ring buffer on the session DBA Dash creates. Only affects Azure SQL Database and Azure SQL Managed Instance, which are the platforms where the managed session uses a ring buffer target. Clamped to 64-4096. |
DeadlockBackfillTimeLimitSeconds | 300 | How long the one-off system_health backfill may run before it stops and keeps what it has read. 0 means no limit. |
The collection’s query timeout can be raised in commandTimeouts.json like any other collection - see Query Timeout. This matters most for the first run against a session, which has no cursor yet and reads everything the session holds.
1MB is the largest ring buffer SQL Server recommends. Above that the target’s data can come back truncated, and truncated XML doesn’t parse - so the whole read is lost rather than part of it. DBA Dash warns when it sees a truncated buffer. A deadlock graph is only a few KB, so 1MB still holds hundreds of them.
FlushDeadlockXERingBuffer empties the deadlock session’s ring buffer after each collection by stopping and starting the session. It is off by default and only ever applies to the session DBA Dash owns, and only when that session uses a ring buffer target (Azure SQL Database and Managed Instance).
A ring buffer read costs what the buffer holds rather than what is new in it - roughly half a second for a full buffer against about thirty milliseconds for an empty one, on every collection. On a database that deadlocks steadily the buffer stays full, so every run pays the full cost to return data that has mostly already been stored.
The trade-off is that a deadlock which has fired but is still in the session’s memory buffer when the session stops is lost. The window is the session’s dispatch latency, which the managed session deliberately keeps short (3 seconds). A flush only happens when the buffer had something in it, so an idle database is never stopped and started at all.
When the managed session is selected, DBA Dash creates DBADash_Deadlocks on first use if it isn’t already there, and starts it if it exists but is stopped:
| Platform | Scope | Event | Target |
|---|---|---|---|
| SQL Server / Amazon RDS | Server | sqlserver.xml_deadlock_report | event_file - 4 files of 10MB in the instance’s own log directory, next to system_health’s |
| Azure SQL Database | Database | sqlserver.database_xml_deadlock_report | ring_buffer |
| Azure SQL Managed Instance | Server | sqlserver.xml_deadlock_report | ring_buffer |
The session is created with STARTUP_STATE=ON so it survives an instance restart.
Azure uses a ring buffer because an event_file target there has to be written to blob storage, which would need a storage container and a credential that DBA Dash would have to be given. The ring buffer needs nothing. What it gives up is persistence - the buffer is emptied when the session stops, which includes a failover - so a deadlock is only collected if a collection runs before the next restart. With the default 5 minute schedule that window is small, and the repository is the archive.
The on-premises files are deliberately small. They exist to bridge a service outage, not to be an archive.
DeadlockCursors.json), so a read costs what is new rather than what the file set holds. The cursor is only advanced once the data has been written, so a failed write is re-read rather than lost.Each deadlock is shredded into four tables in the repository:
| Table | Contents |
|---|---|
dbo.Deadlocks | One row per deadlock - event time, signature, process/victim/resource counts, parallel flag |
dbo.DeadlockProcesses | One row per process involved, with application, database, login, host, procedure, statement, isolation level, wait details |
dbo.DeadlockResources | One row per contended resource, with object, index, lock mode, owners and waiters |
dbo.DeadlockXml | The original deadlock graph, gzip compressed |
The graph is stored separately so it can carry a shorter retention than the shredded rows - a graph runs to several KB, and a parallel deadlock over a large table can run to hundreds.
Every deadlock carries a DeadlockHash - a hash of the graph XML with whitespace normalised but every attribute value kept. It forms part of the primary key of all four tables, so re-reading the same deadlock is harmless by construction. That covers overlapping polls, a cursor reset after a service restart, a switch of capture source, and the system_health backfill overlapping the dedicated session.
A signature is a stable identifier for the shape of a deadlock, serving a similar purpose to query_hash for queries. Two deadlocks share a signature when the same code deadlocks over the same objects in the same way.
Included: the modules or statements involved (literals stripped, so the same statement against different rows still groups), the objects and indexes contended, the lock modes, the isolation levels, and which process was the victim.
Excluded: everything that varies between occurrences of one problem - spids, transaction ids, timestamps, hosts, logins, wait times, hobt ids, lock ids, and the literal values in the statements.
The signature is what the reports group by, and what an AI analysis is cached against - the answer to “why does this deadlock” is the same answer every time it recurs.
Signature versions. The signature version is stored with each deadlock so that a change to how signatures are computed is visible rather than silently regrouping history. When DBA Dash is upgraded and the version changes, the service recomputes signatures for stored deadlocks in the background as a low priority work item (in batches, every 10 minutes) until there is nothing left to do, then stops. Stored AI analyses are recomputed from their own graphs at the same time, so an answer follows the deadlock it was actually about. Deadlocks older than the graph retention are skipped - there is no graph left to recompute from.
You can see exactly what a signature was computed from with the Signature button in the deadlock viewer.
A Deadlocks folder appears in the tree under each monitored instance, containing two reports.
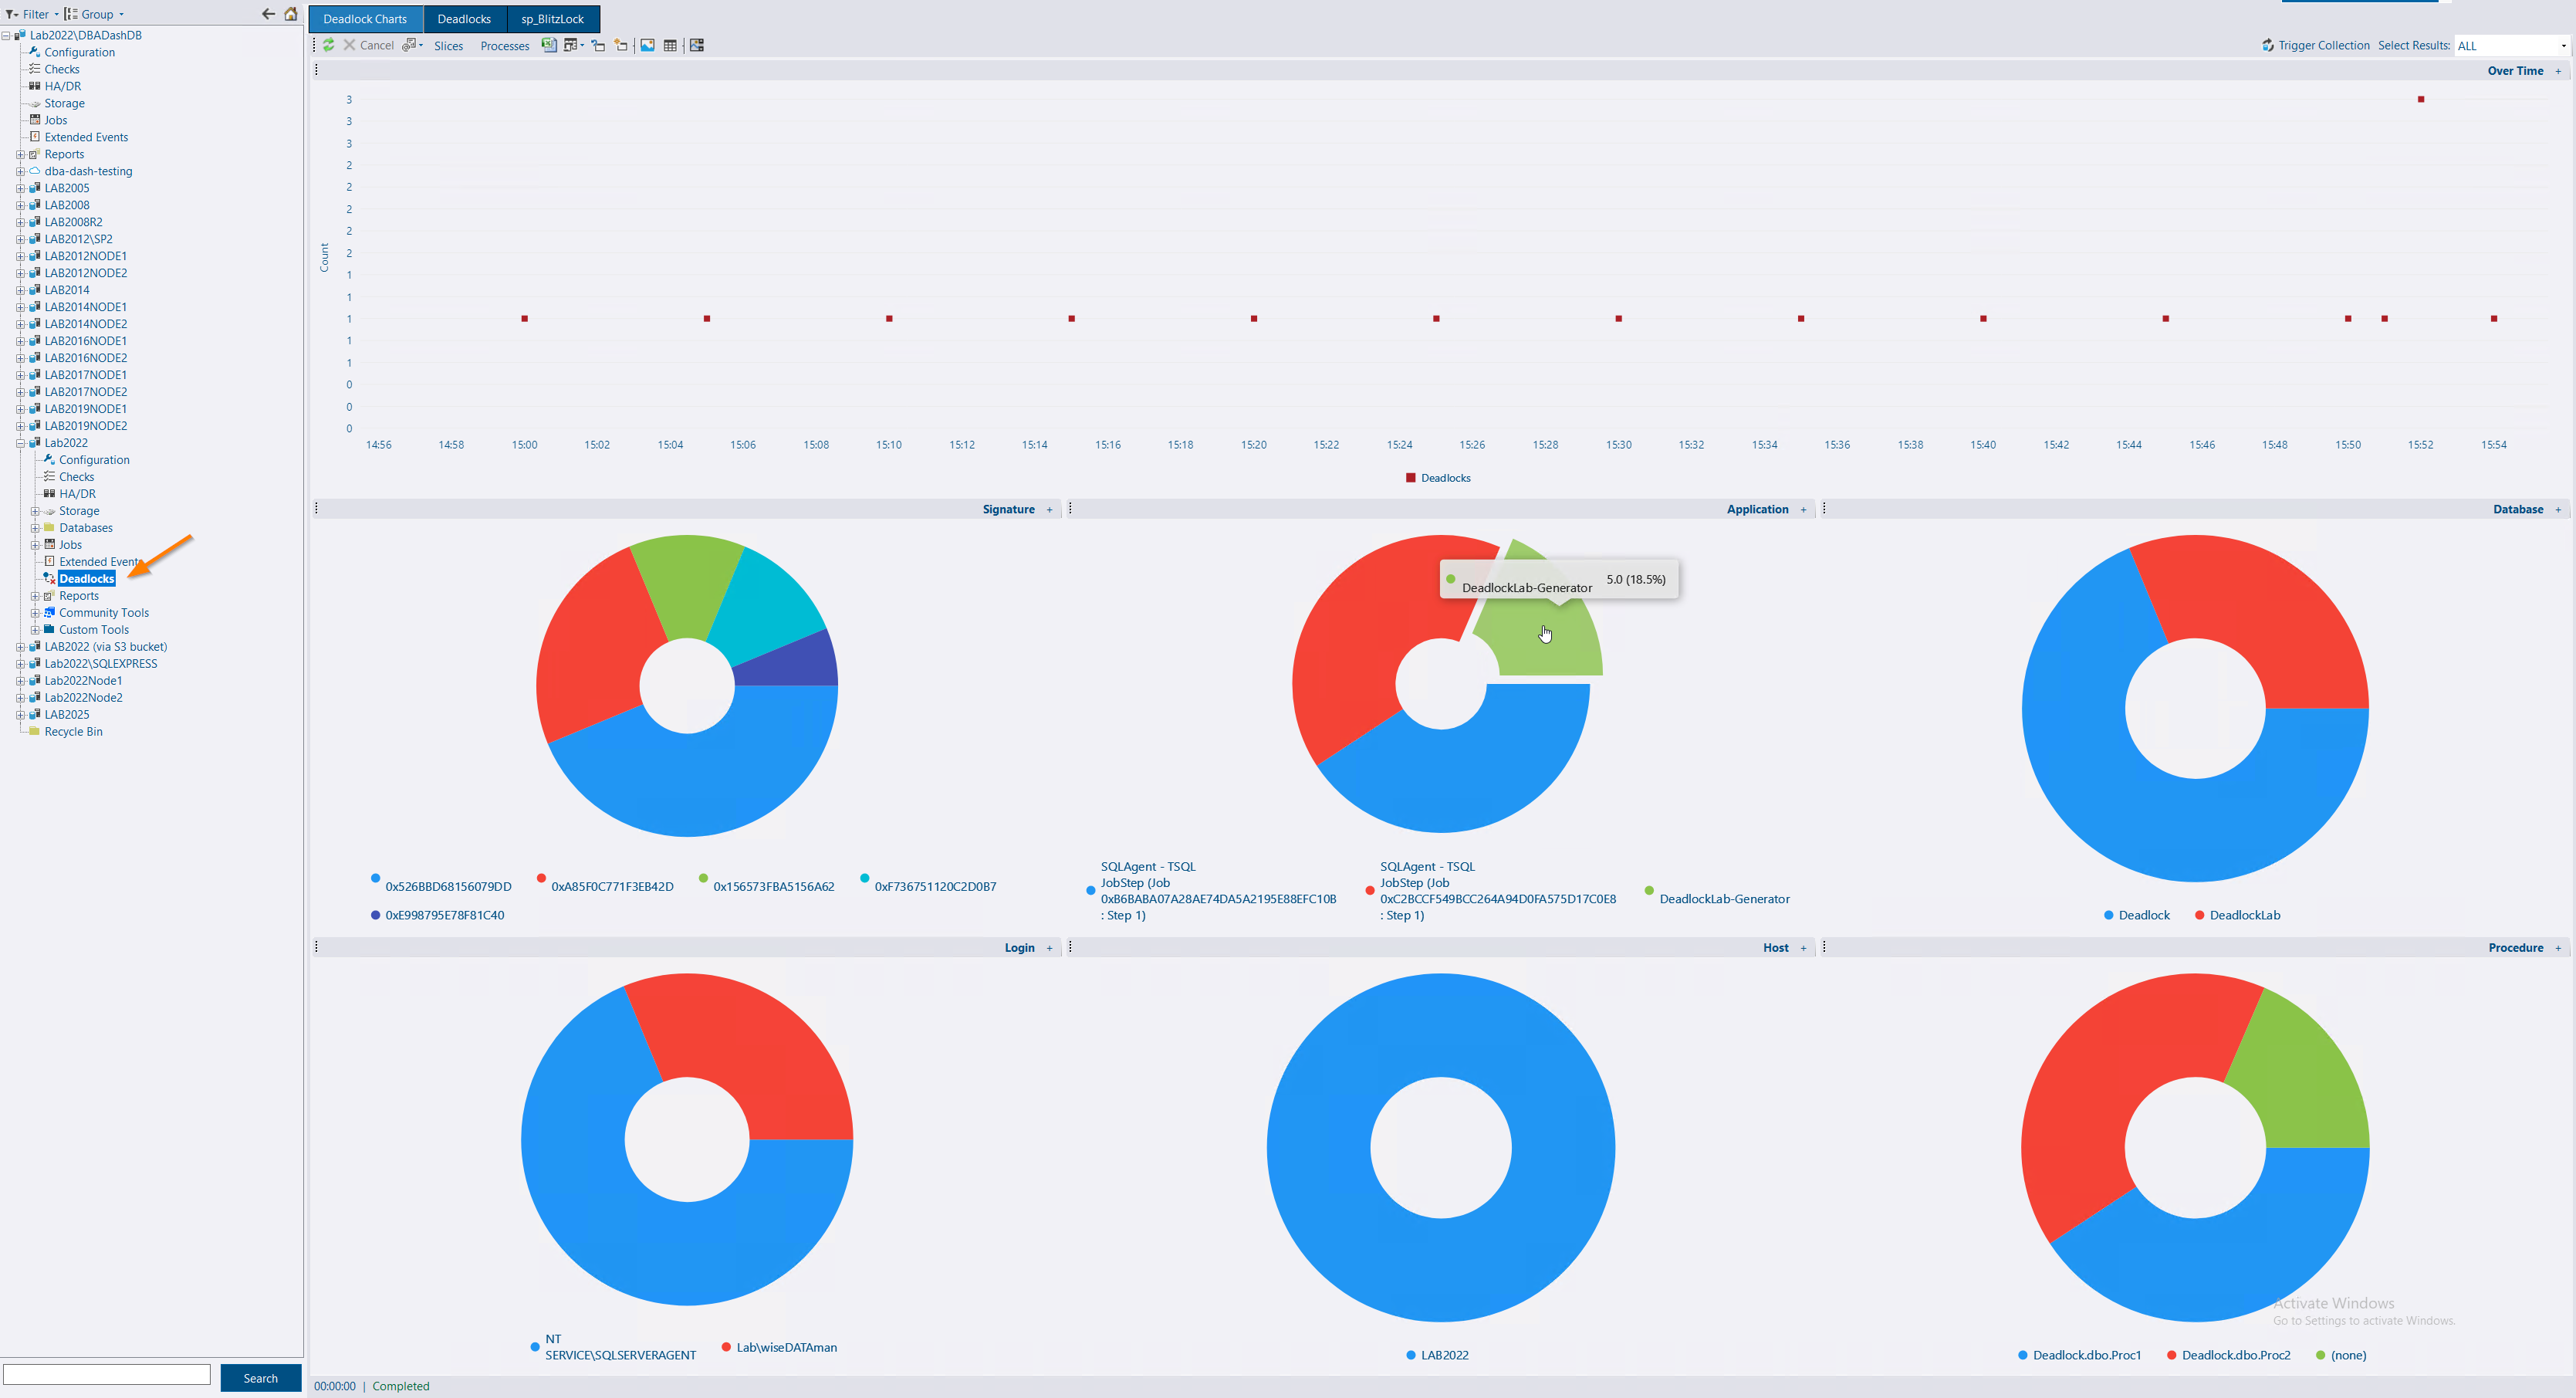
Deadlock counts over time, with pie charts breaking the total down by signature, application, database, login, host or procedure. This gives a high level view of where to focus. Every chart supports drill-down into the detail.
Toolbar options:
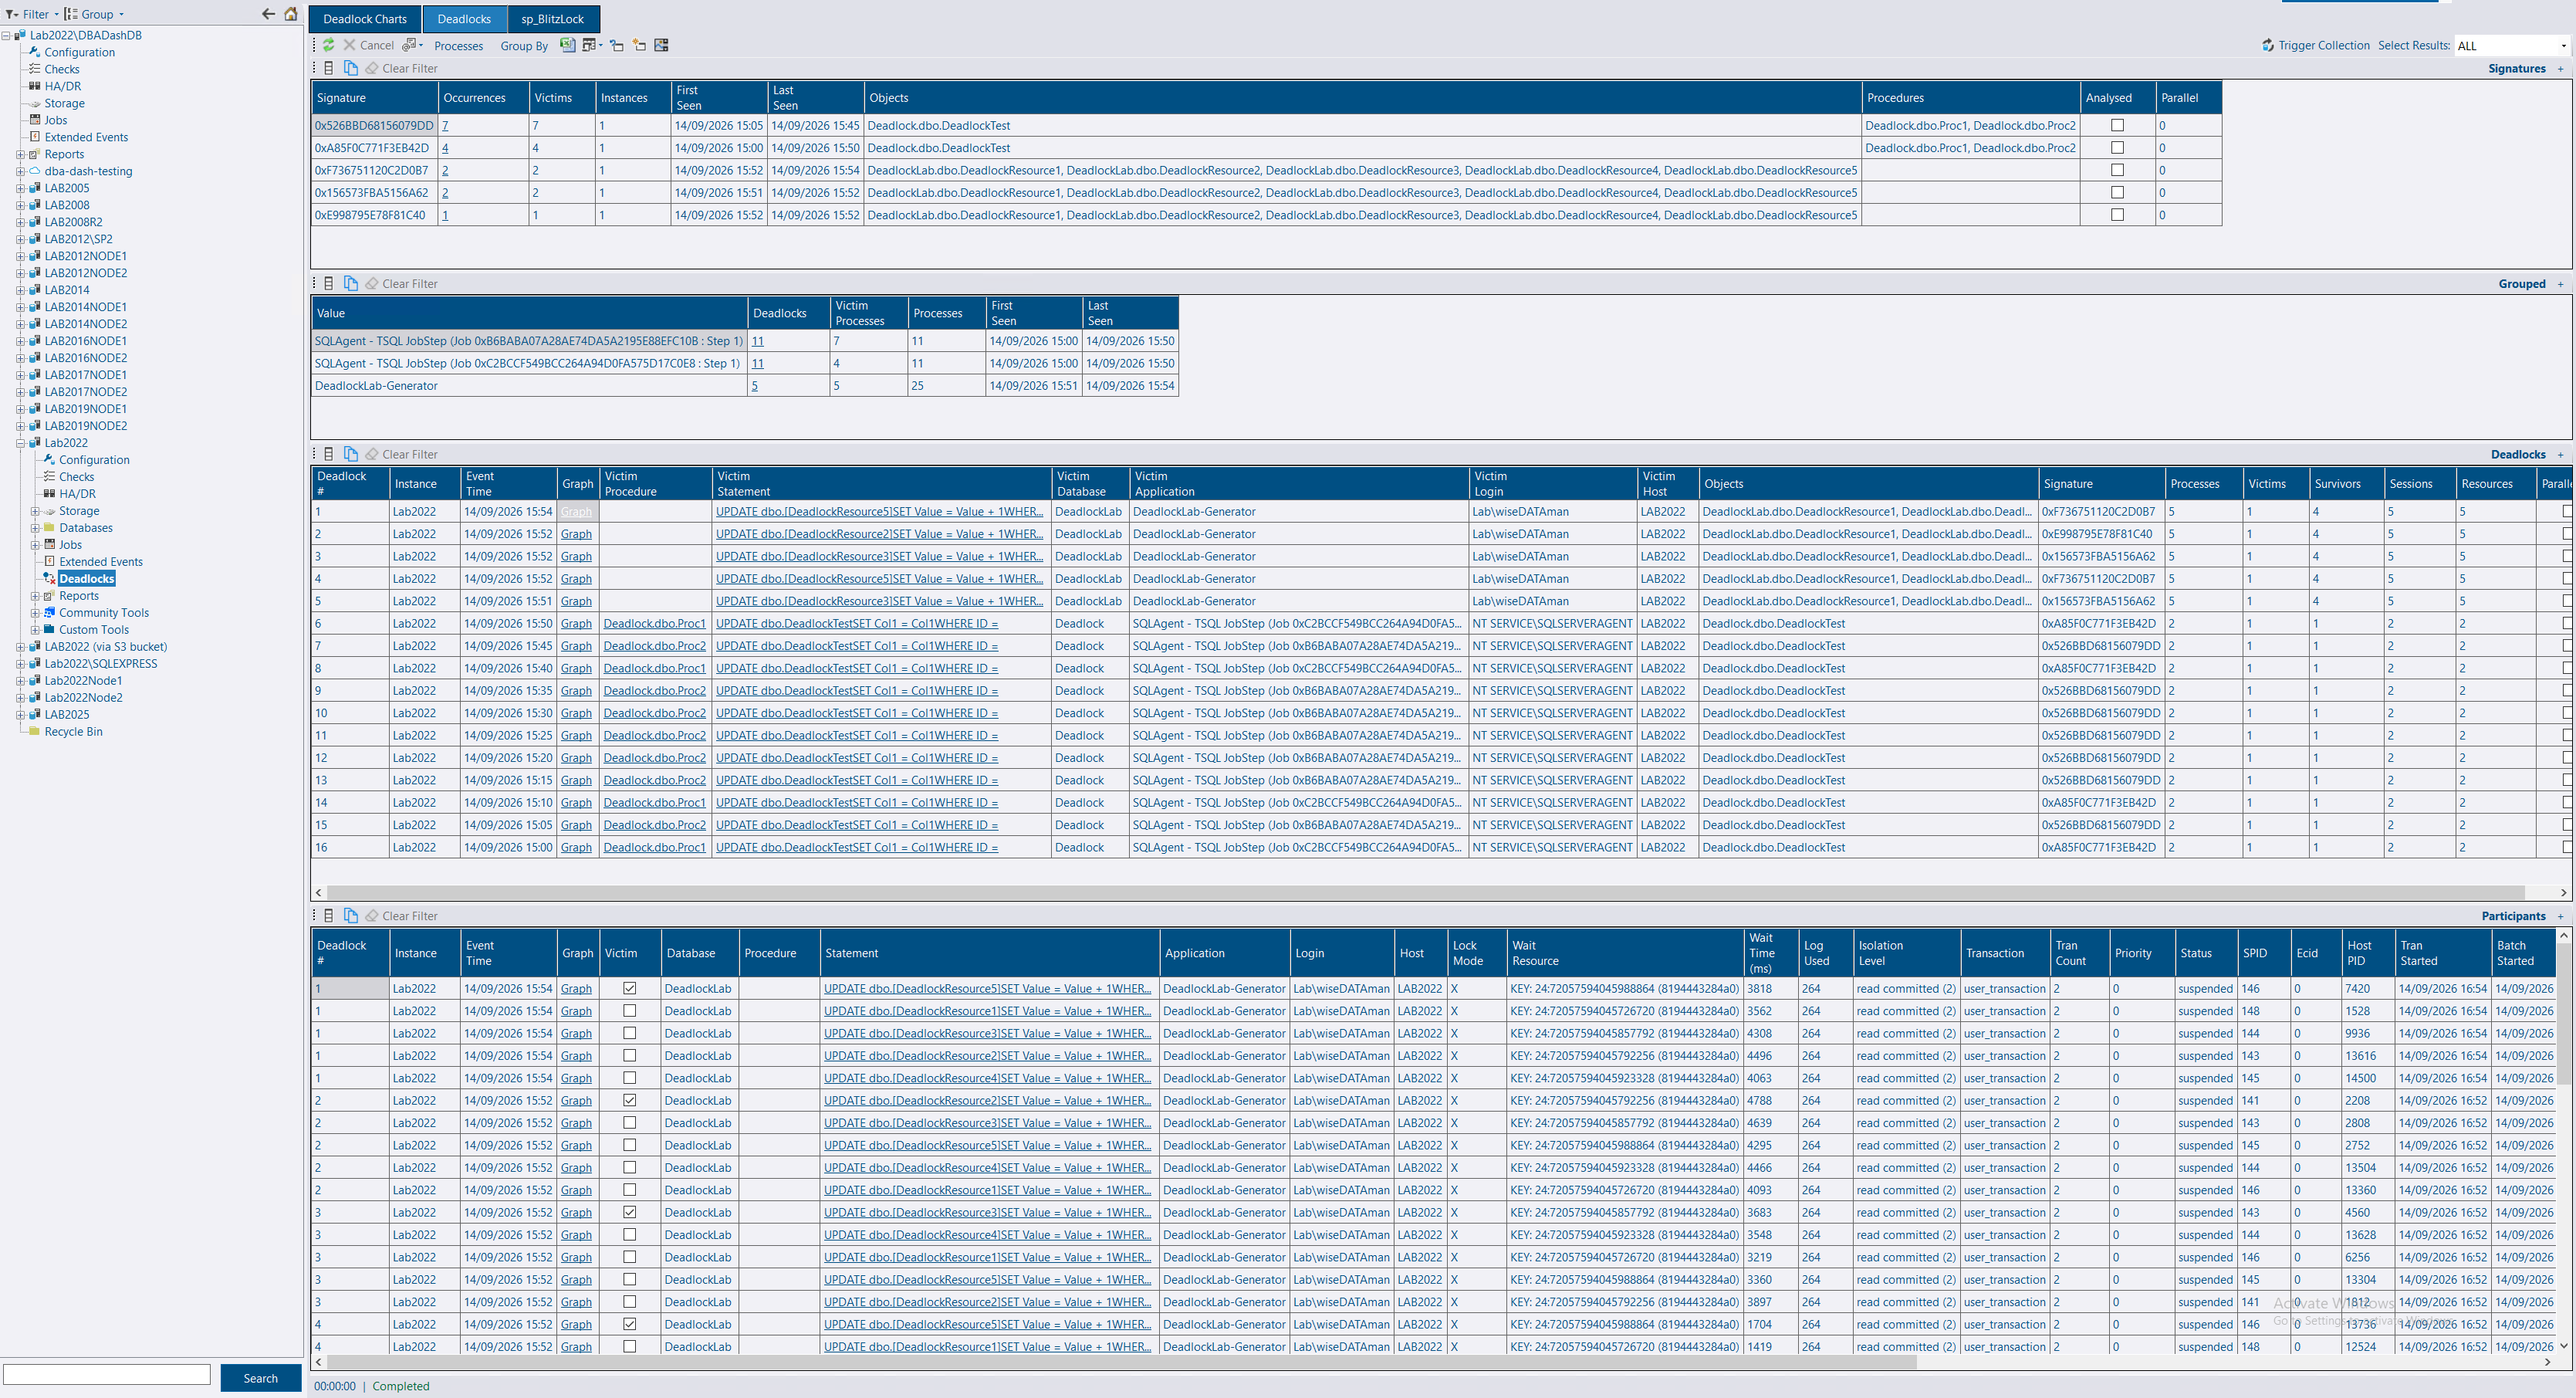
The same detail for the selected time period, in four results:
Clicking the Graph link in results 3 and 4 opens the deadlock viewer.
The report opens on the signature summary deliberately: “what deadlocks do we have” is a more useful first question than “what deadlocked at 14:07”.
The Trigger Collection button on the toolbar runs the Deadlocks collection once, on demand. On an instance that isn’t configured for deadlock capture at all, this reads that instance’s system_health session - read only, nothing is created or altered - and what it finds is stored and reported like any other deadlock. It’s the quickest way to look at an instance’s recent deadlocks without configuring collection first.
Triggering a collection requires the messaging feature to be configured.
Where the Deadlocks collection is enabled, the deadlock markers on the Performance tab count the deadlocks DBA Dash stored. The counts are exact, they are filtered to the database when you are at database level, and each point opens the Deadlocks report for the window it counted. View > Deadlock Counts switches back to the Locks\Number of Deadlocks/sec\_Total performance counter when you want the longer history from before the collection was enabled. That counter is engine-wide. On Azure SQL Database it includes deadlocks that never touched the database you are looking at. The choice is saved with the performance view.
The sp_BlitzLock drill-down remains available. With native collection enabled it is no longer required.
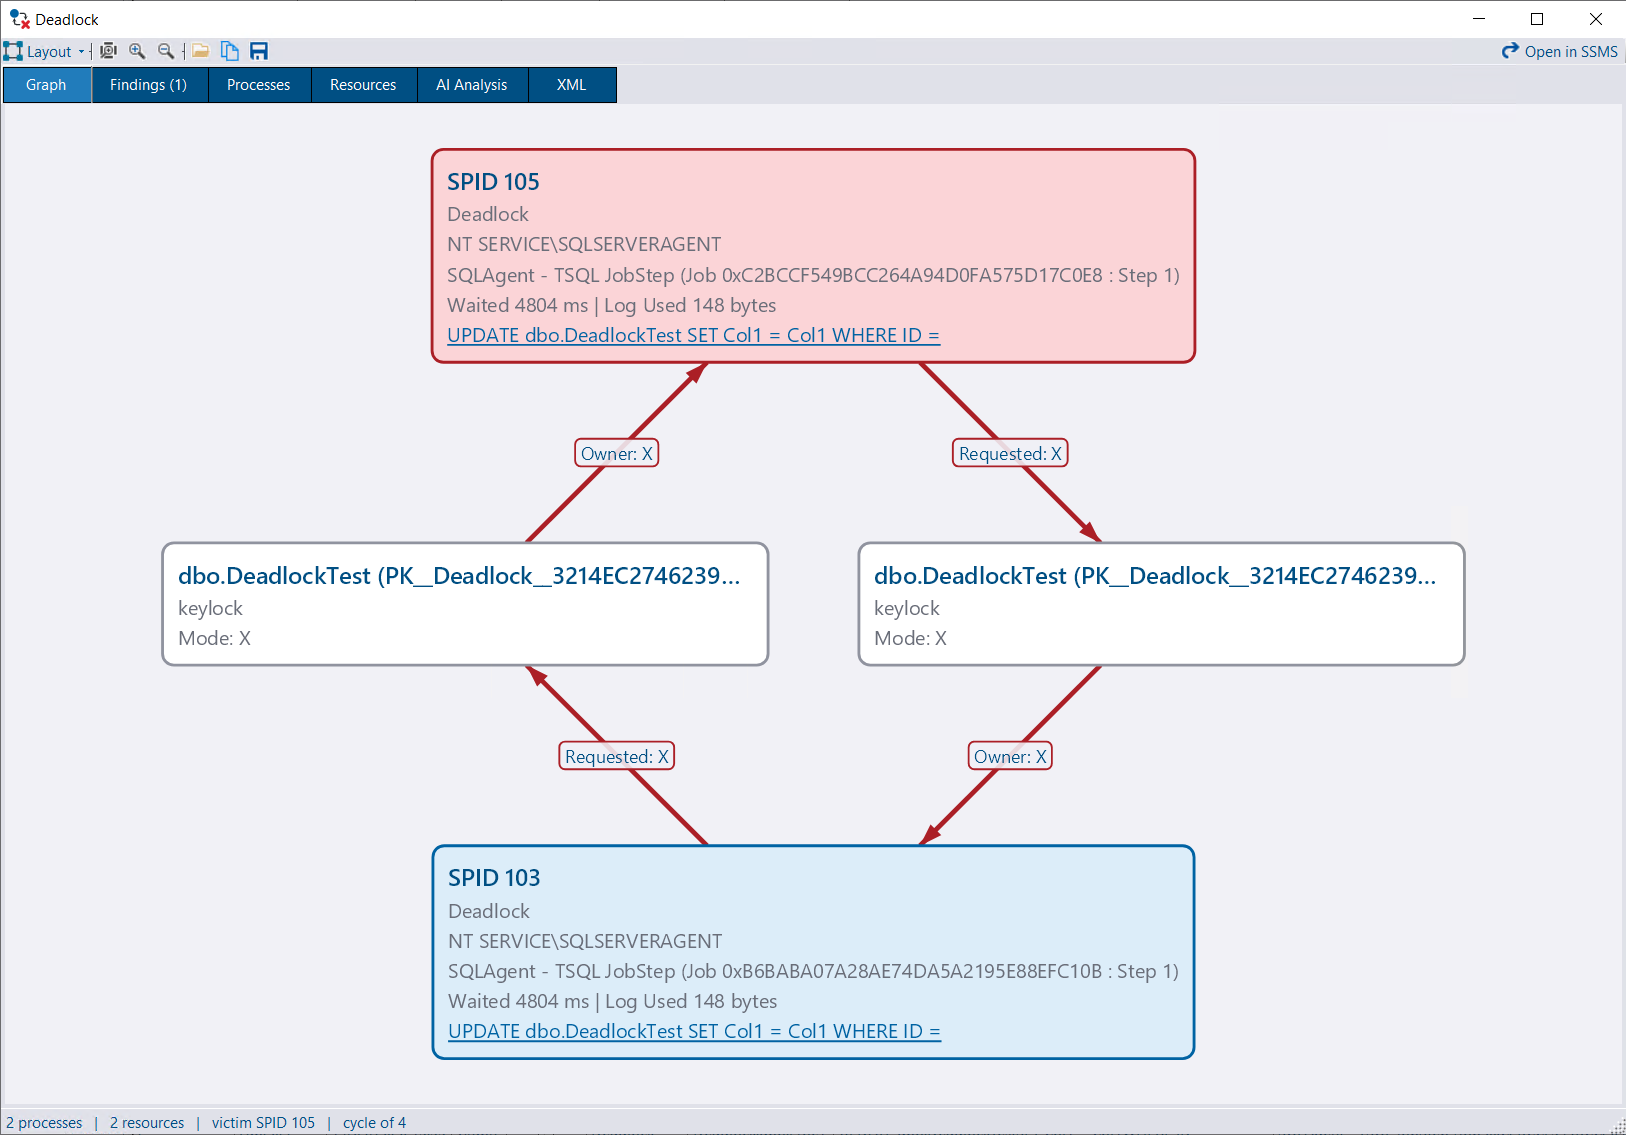
The viewer visualises the deadlock and lets you inspect the relationships between its processes and resources. It opens from the Graph link in the reports, and from Tools > Open Deadlock Graph | *.xdl for a graph saved from SSMS, the system_health session or the viewer itself.
Each deadlock opens in its own tab, in the same window as the query plan viewer. Drag and drop .xdl files onto the window to open them.
The viewer is also available without DBA Dash in the standalone DBA Dash Visualizer, and can be opened directly from SSMS with the SSMS extension.
Two layouts, chosen from the Layout menu and remembered for next time:
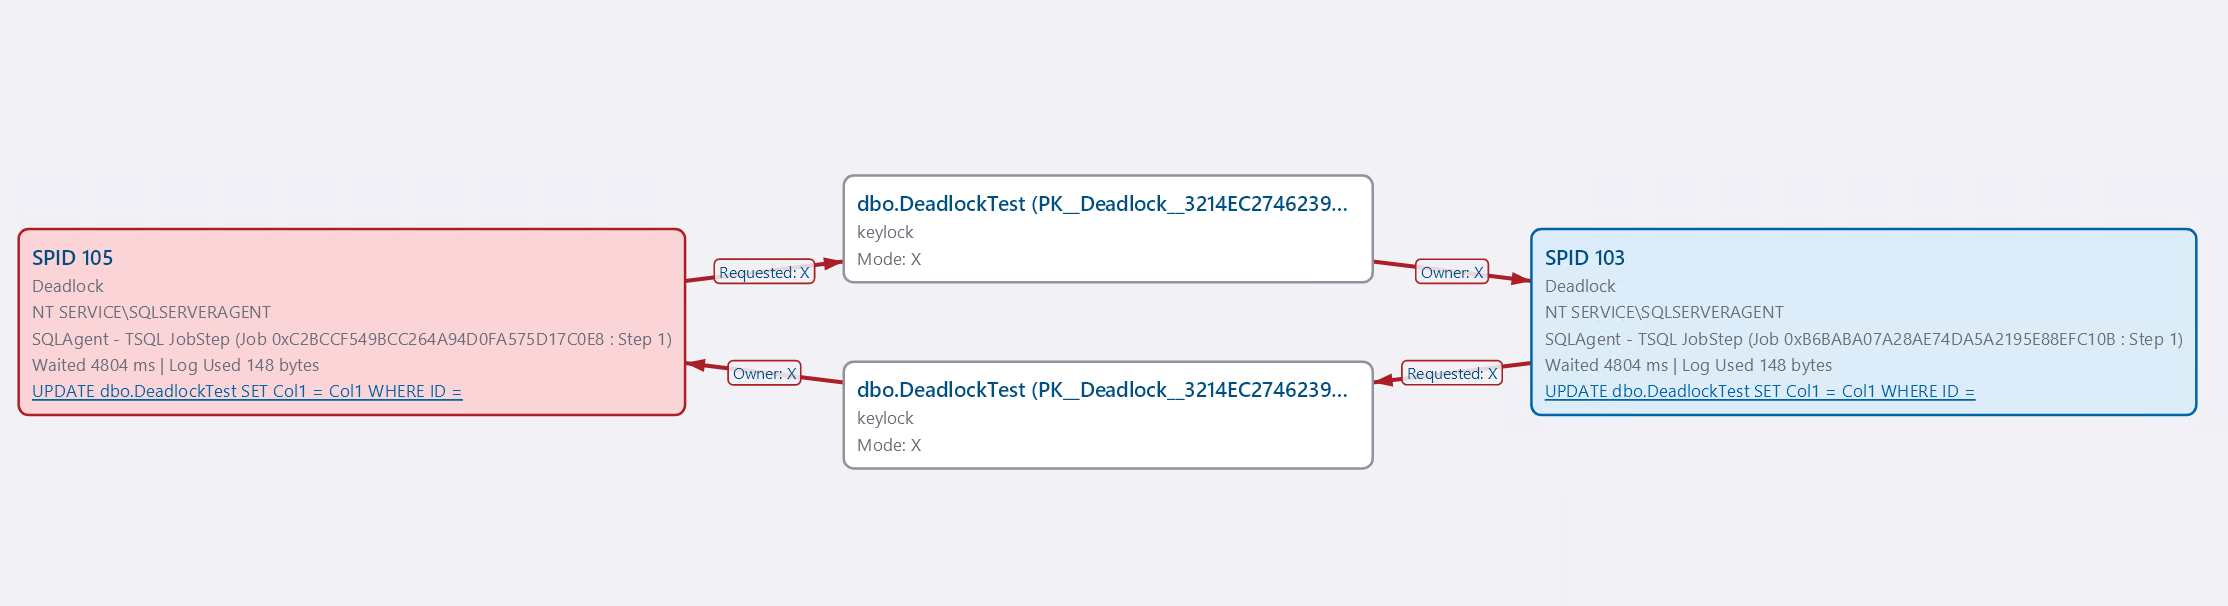
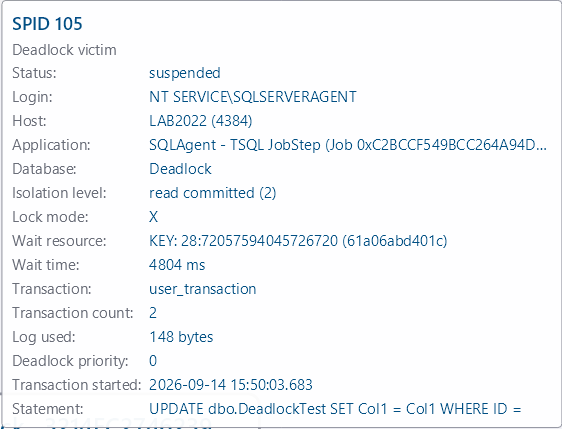
Right-click a node for View Statement, Copy Statement, Copy SPID, Copy Object Name, Copy Details, Show in Processes Grid / Show in Resources Grid, and - where the source instance is known and messaging is configured - Plans and Query Store.
Toolbar: zoom in/out, Fit, Open… (another .xdl), Copy Image, Save As…, Signature, and Open in SSMS (hands the graph to whatever handles .xdl files). Where the source file contained more than one deadlock - common for a .xdl saved from system_health - a Deadlock selector appears.
| Tab | Contents |
|---|---|
| Graph | The visualisation, with a properties grid for the selected object |
| Findings | Static analysis of the graph. The caption carries the finding count |
| Processes | The parsed process list - login, application, host, database, isolation level, statement, wait details. The Plans link opens the plans cached on the instance for that statement, with their execution stats |
| Resources | The parsed resource list - object, index, lock mode, owners and waiters |
| AI Analysis | Optional AI-driven analysis |
| XML | The original deadlock graph |
A deadlock graph identifies its statements by SQL handle - the handle of the whole batch or module - so there is rarely exactly one plan behind it. The Plans panel lists all of them; the row matching the graph’s statement offset is flagged and sorted to the top. Plan XML is collected on demand through the same path the running queries screen uses, and lands in the repository on the way past.
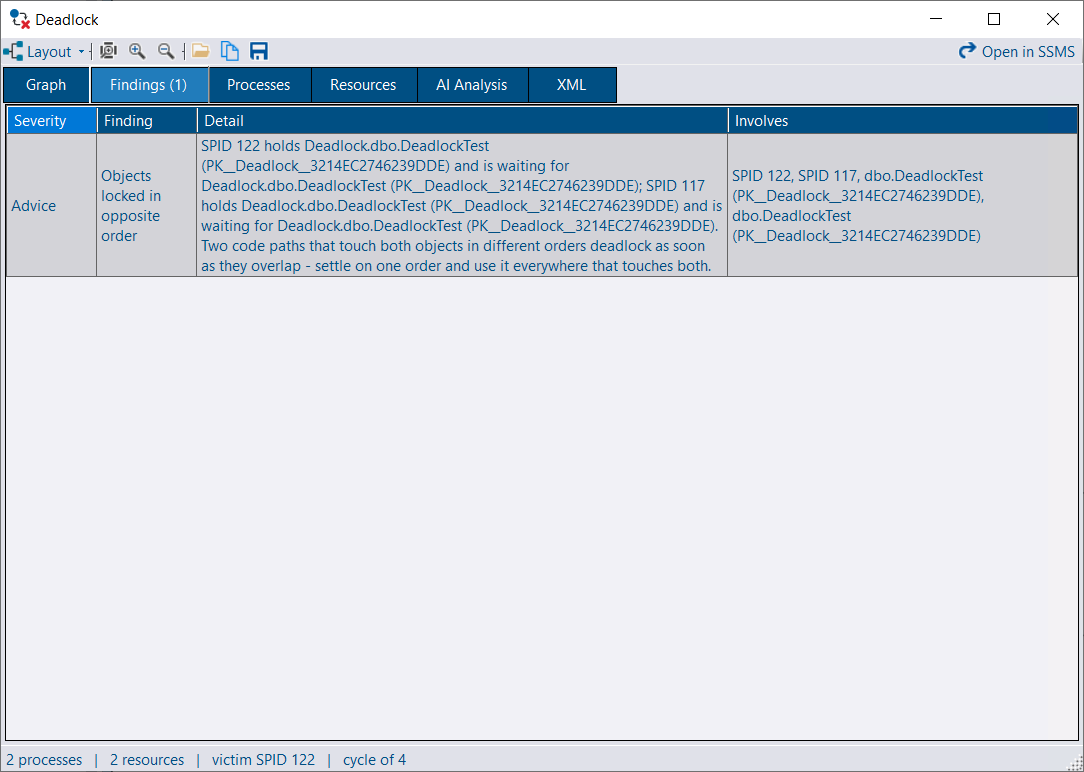
The Findings tab analyses the deadlock XML directly - no AI service required, nothing leaves your environment. Findings are ranked with warnings first, then advice, then information.
Examples of what it detects:
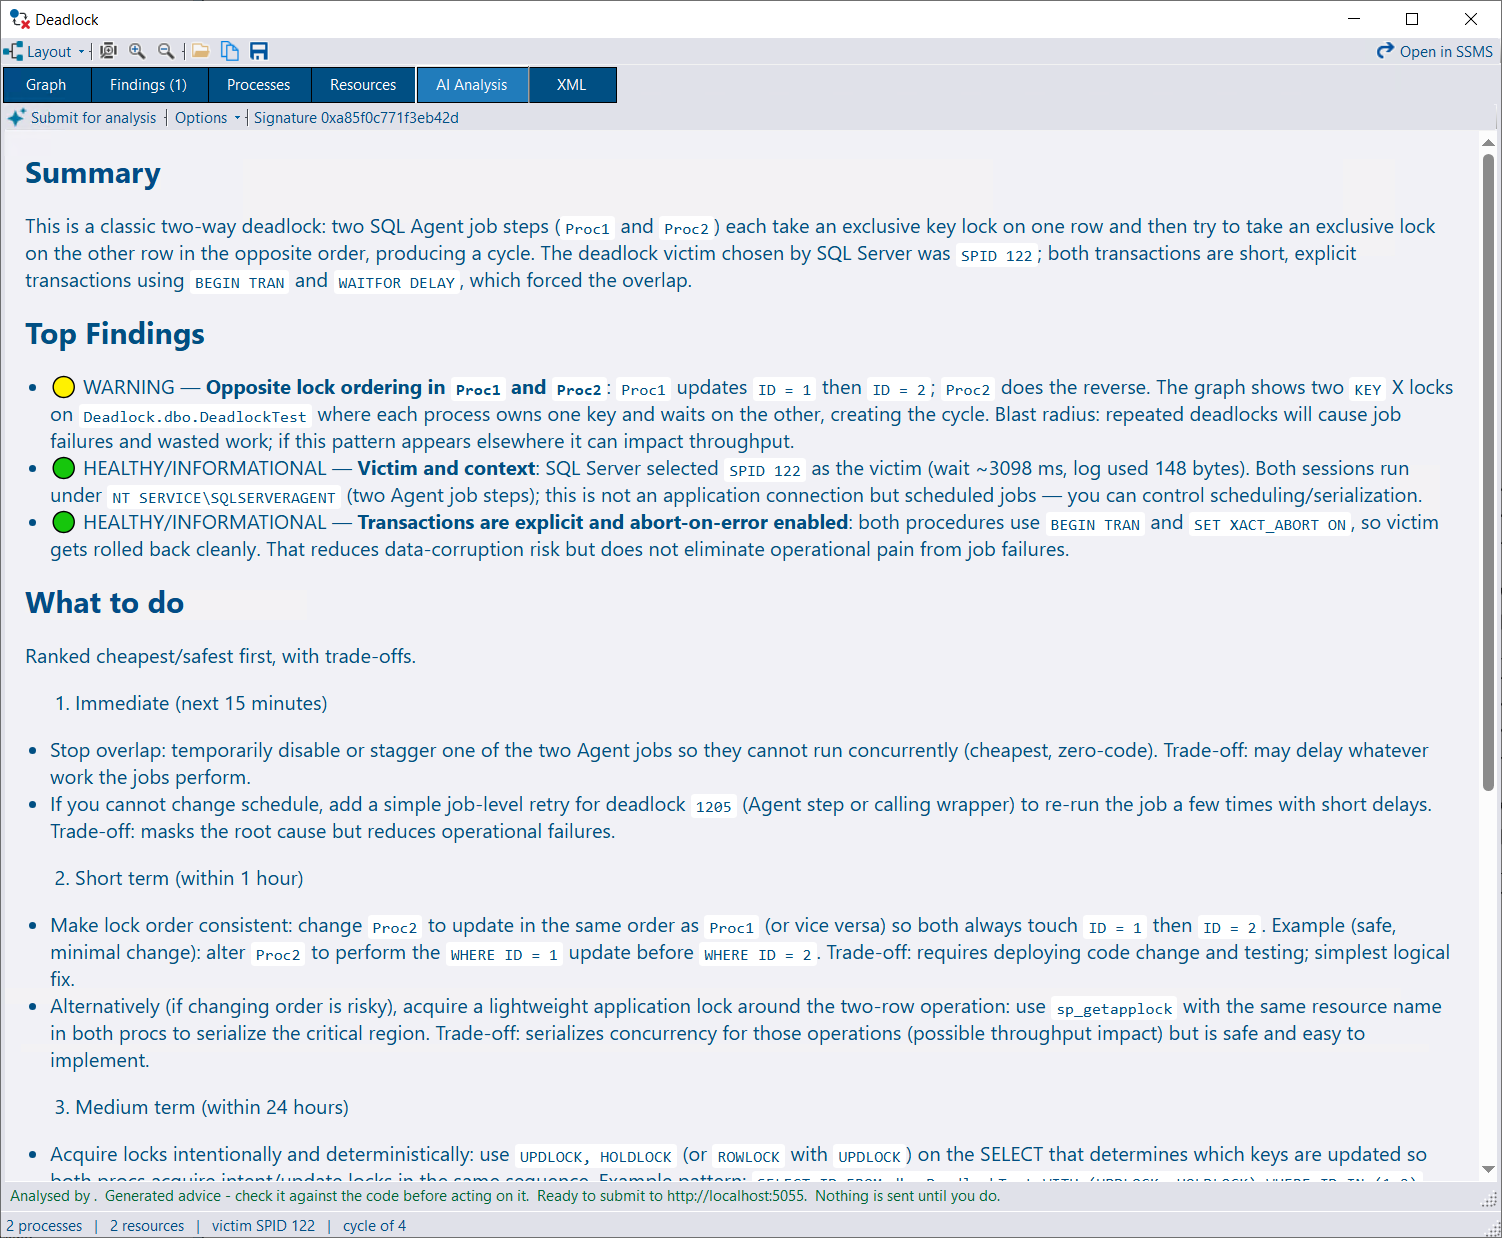
With the AI Assistant service configured, the AI Analysis tab can send a deadlock for detailed observations and recommendations.
Nothing is sent until you press Submit for analysis. The panel above the button is not a description of what will be sent - it is the payload, rendered by the same object that is serialised, so the two can’t drift.
Read it before pressing send. A deadlock graph carries the statements as they ran, and those routinely include parameter values.
Every answer is kept, and looked up by pattern as well as by occurrence:
Answers are never replaced. Two runs of one model over one graph rarely say the same thing, and asking again is often a search for a better answer rather than a correction of a wrong one. Analyses are only ever created by someone pressing the button, so the table stays small.
The Analysed column on the Signatures report shows which patterns already have an answer.
You can ask follow-up questions to continue the conversation. A conversation about another occurrence of the same signature can also be continued - that’s the point of storing answers against the pattern.
The initial analysis is stored in the repository database and shared with other users. Your follow-up questions and answers are private to you - see AI conversations.
Default retention for the deadlock tables:
| Table | Default retention |
|---|---|
dbo.Deadlocks | 365 days |
dbo.DeadlockProcesses | 365 days |
dbo.DeadlockResources | 365 days |
dbo.DeadlockXml | 90 days |
The graph carries a shorter retention than the shredded rows on purpose: keeping trend and grouping for a year costs little, keeping every graph for a year does not. After the graph is purged the deadlock still counts, groups and reports - only the viewer has nothing to open.
Adjust these under Options > Data Retention in the GUI. See Data Retention.
“Enable the Deadlocks collection in the service config tool to see data here.”
The Deadlocks collection has never run for the instance(s) in scope. Check that a capture option is selected for the connection, and that the Deadlocks schedule hasn’t been cleared. Use Trigger Collection to read system_health once in the meantime.
“Extended events session ‘<name>’ is not running.” Deadlock collection reads the session but never starts one it doesn’t own. Start the session on the instance (or on the database, for Azure SQL Database), or point the collection at a session that is running.
Collection fails with a permissions error.
The managed session needs ALTER ANY EVENT SESSION to be created and started. Either grant it, or switch to system_health / an existing session, which need only VIEW SERVER STATE.
The first collection is slow or times out.
The first run against a session has no cursor to resume from, so it reads everything the session holds. For system_health that includes all the unrelated events it captures, which can be slow. Raise the Deadlocks collection timeout in commandTimeouts.json (Query Timeout). A read that times out never advances the cursor, so it will otherwise time out on every subsequent run too.
No deadlocks appear after enabling a dedicated session.
A new session starts empty and captures from that point forward. Historical deadlocks come from the system_health backfill - check Backfill Deadlocks is enabled for the connection.
Deadlocks are missing on Azure SQL Database.
The ring buffer is emptied when the session stops, which includes a failover. A deadlock is only collected if a collection runs before the next restart. Make sure the Deadlocks collection is scheduled frequently enough, and consider increasing DeadlockXERingBufferKB if the service has been offline.