Title here
Summary here
This page explains how to run, save, and manage ad‑hoc Extended Events (XE) traces in DBA Dash. It covers multi‑instance tracing, templates, history, export options, and the required configuration and repository security.
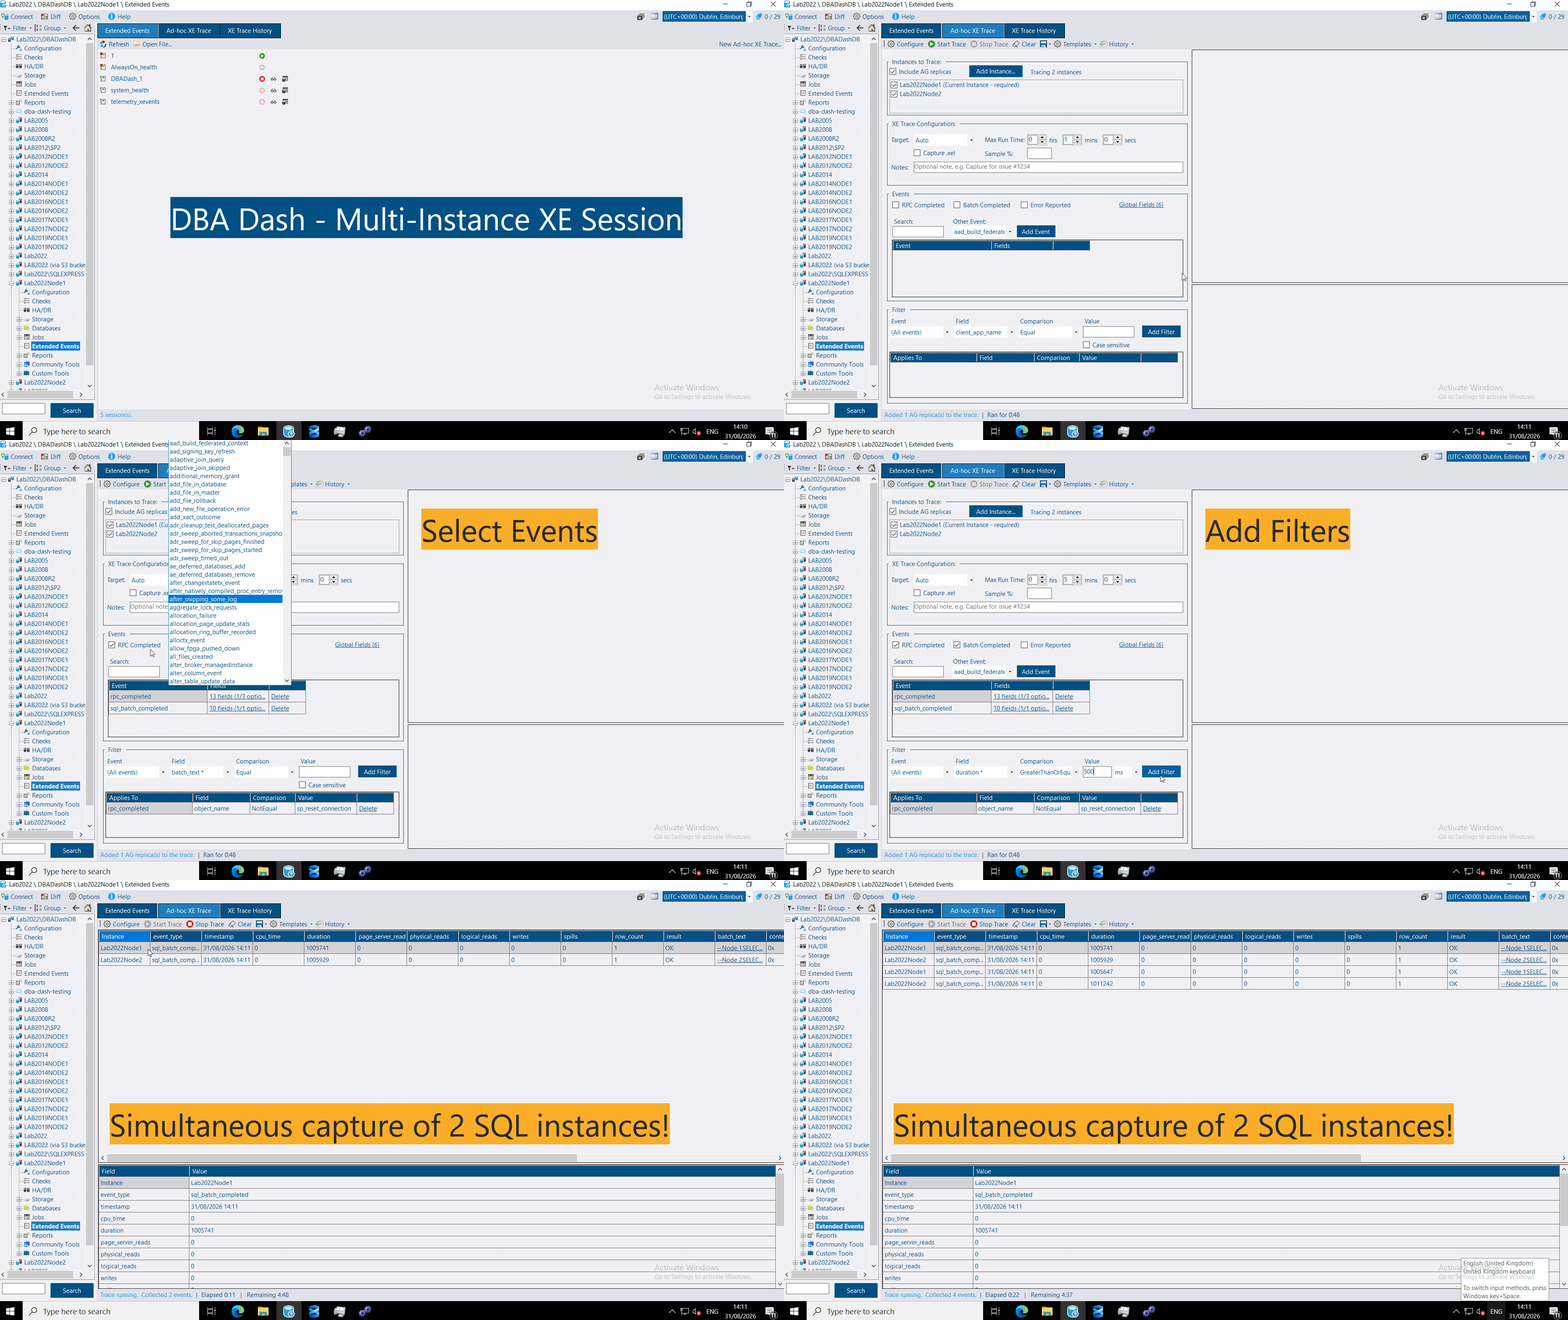
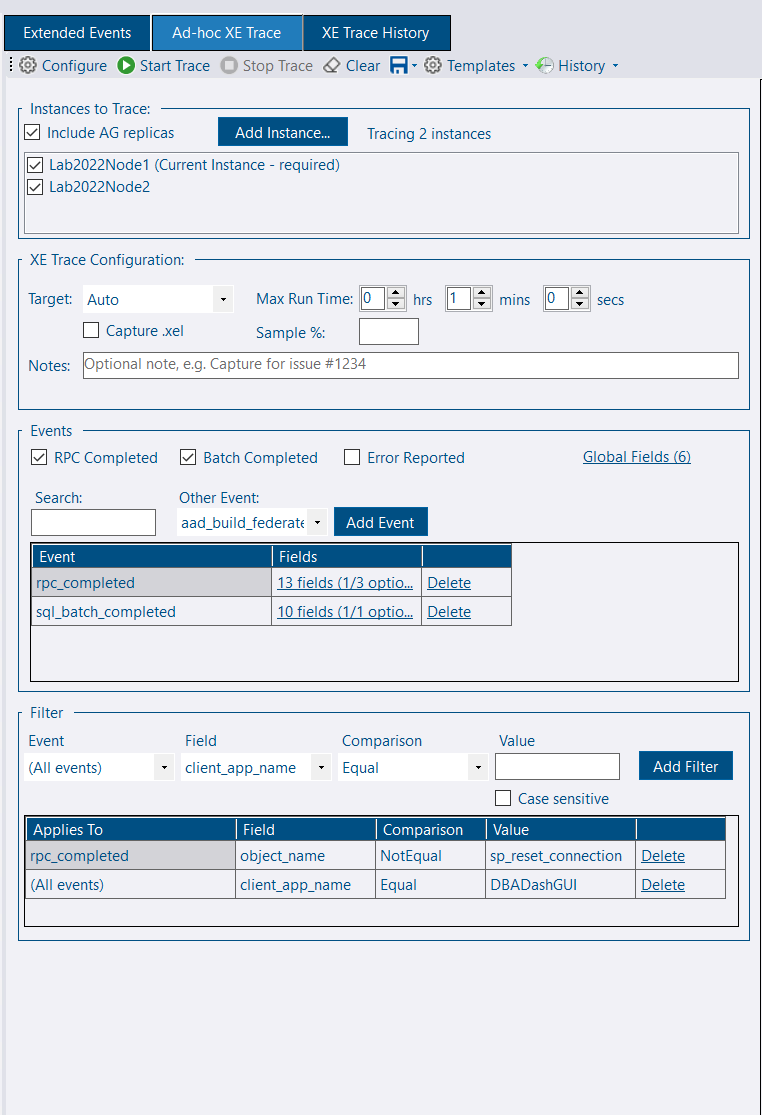
Select the instance(s) you want to trace. If you open the “Extended Events” node under a specific SQL instance, that instance is preselected. From the root you can add instances using the Add Instance button.
DBA Dash can trace multiple SQL instances simultaneously and present a combined result set. This is useful when tracing activity across an Availability Group (primary + replicas) or multiple Azure databases.
Adjust the trace duration and any other properties. The default duration is 1 minute — increase or decrease as needed.
Select which events to capture. Common events are provided as shortcuts:
rpc_completed (RPC Completed)sp_reset_connection (connection pool resets). Remove the filter if you need those events.sql_batch_completed (Batch Completed)error_reported (Error Reported)severity >= 11 to remove informational messages. Remove or edit the filter if you wish to capture other severities.Use the event dropdown to browse the full event list; use the search box to filter a large list. You can also select global and event-specific fields from the grid link.
Client activity typically appears as either rpc_completed or sql_batch_completed events.
Apply filters to limit collected events to the subset you care about:
Duration and cpu_time filters accept values in milliseconds (ms) by default for convenience; you can switch to microseconds, seconds, or minutes as needed.
Start the trace by clicking “Start Trace” and wait for the results to appear.
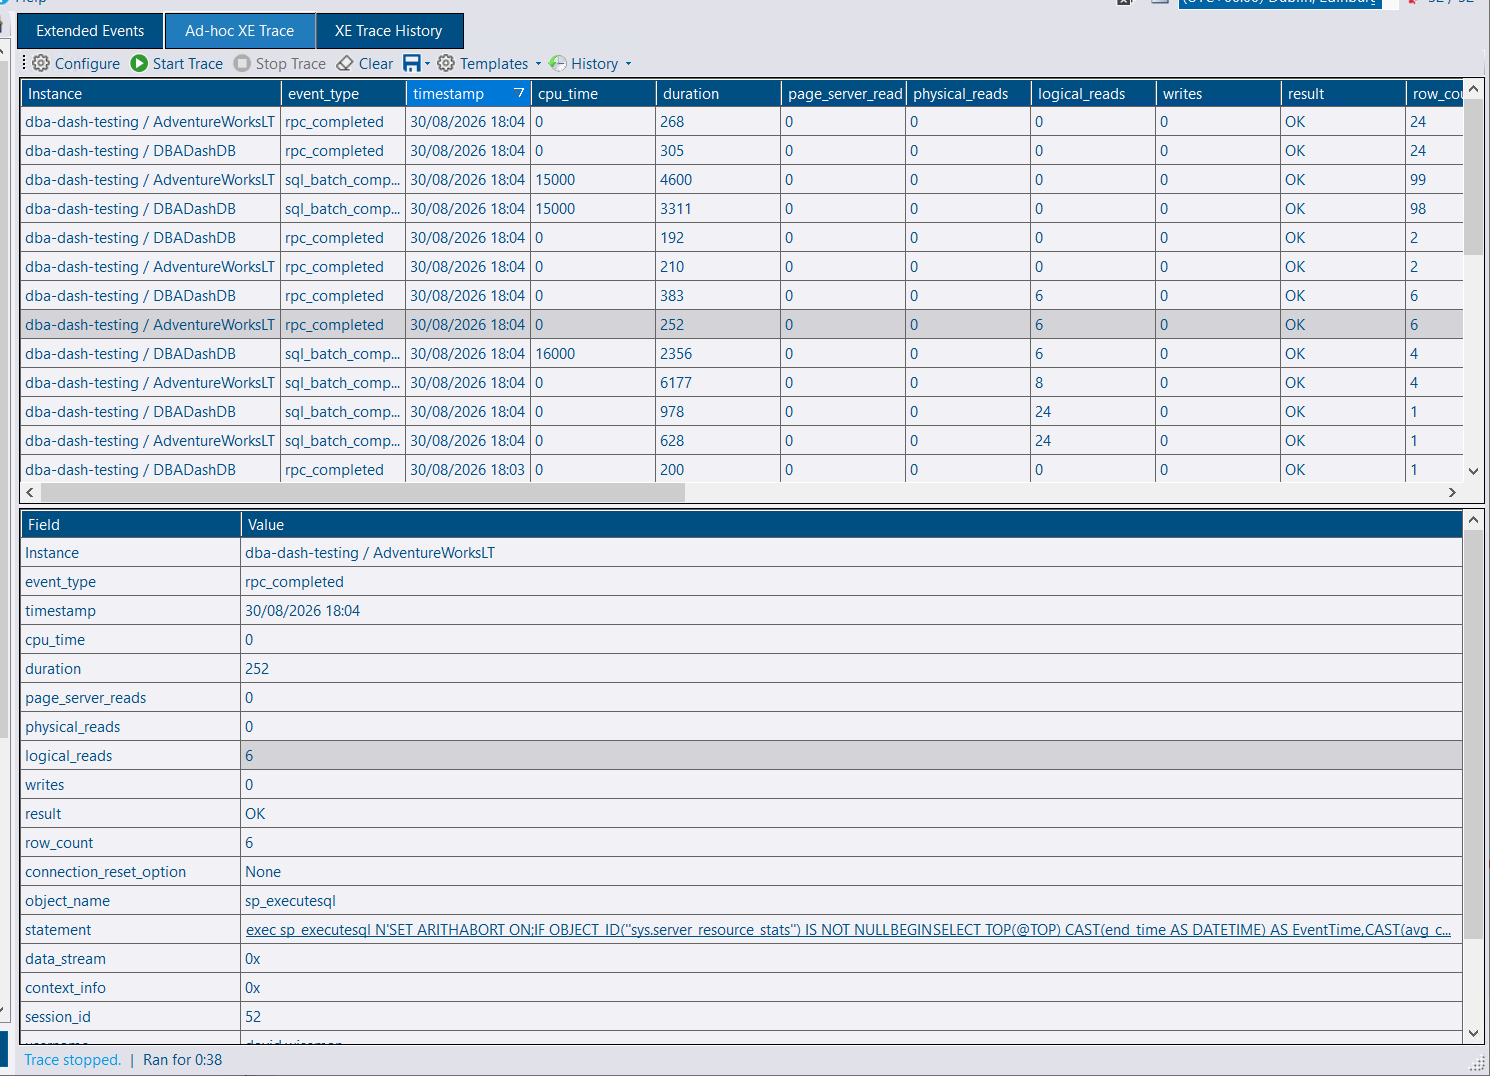 Screenshot shows events collected from two Azure DBs.
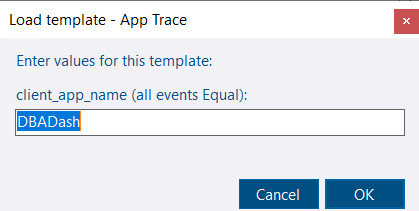
Templates let you save and reload an XE configuration quickly.
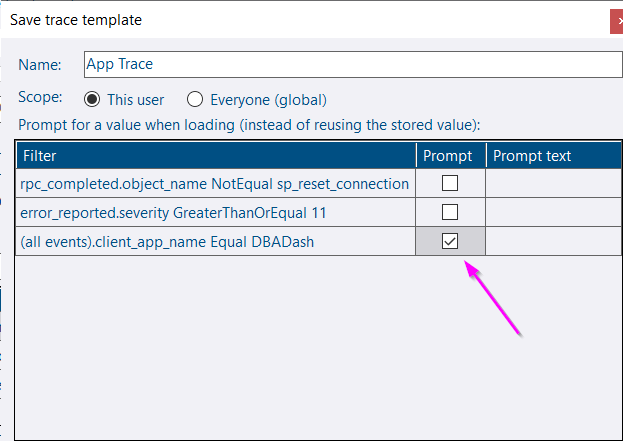
You can define template parameters so the UI prompts for values when loading a template (for example, application name or session_id).
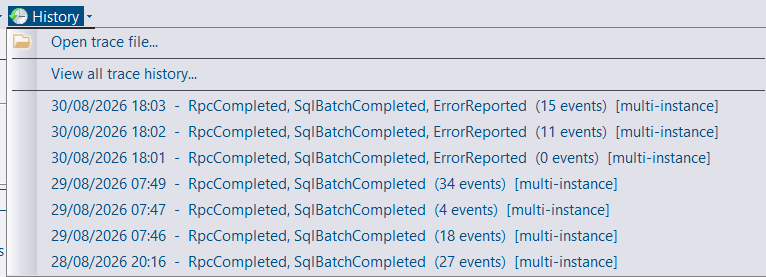
The History menu provides quick access to recent traces for the current context.
The XE Trace History tab shows details for traces you ran, with actions to view data, delete traces, or copy the generated CREATE EVENT SESSION script. By default you can see only your own traces unless you are db_owner on the repository database.

Traces are retained for 30 days by default; retention is configurable in the data retention settings (XETraceEvent, XETraceSession tables).
Traces can be exported to disk in JSON or XML formats (compressed and uncompressed). Exported traces can be reloaded using the “Open Trace file…” option in the History menu.
Native .xel export is only supported when the “Capture .xel” option is enabled when creating the trace.
XE sessions are triggered from the GUI via the messaging feature. Sessions are created and managed under the DBA Dash service account. The Extended Events functionality is disabled by default and must be enabled in the Service Configuration tool (Messaging tab). Access is then controlled via repository database role membership.
To enable Extended Events:
* to allow all sessions and prefix a session with - to exclude it (for example: *,-system_health,-AlwaysOn_health,-telemetry_xevents)* = all)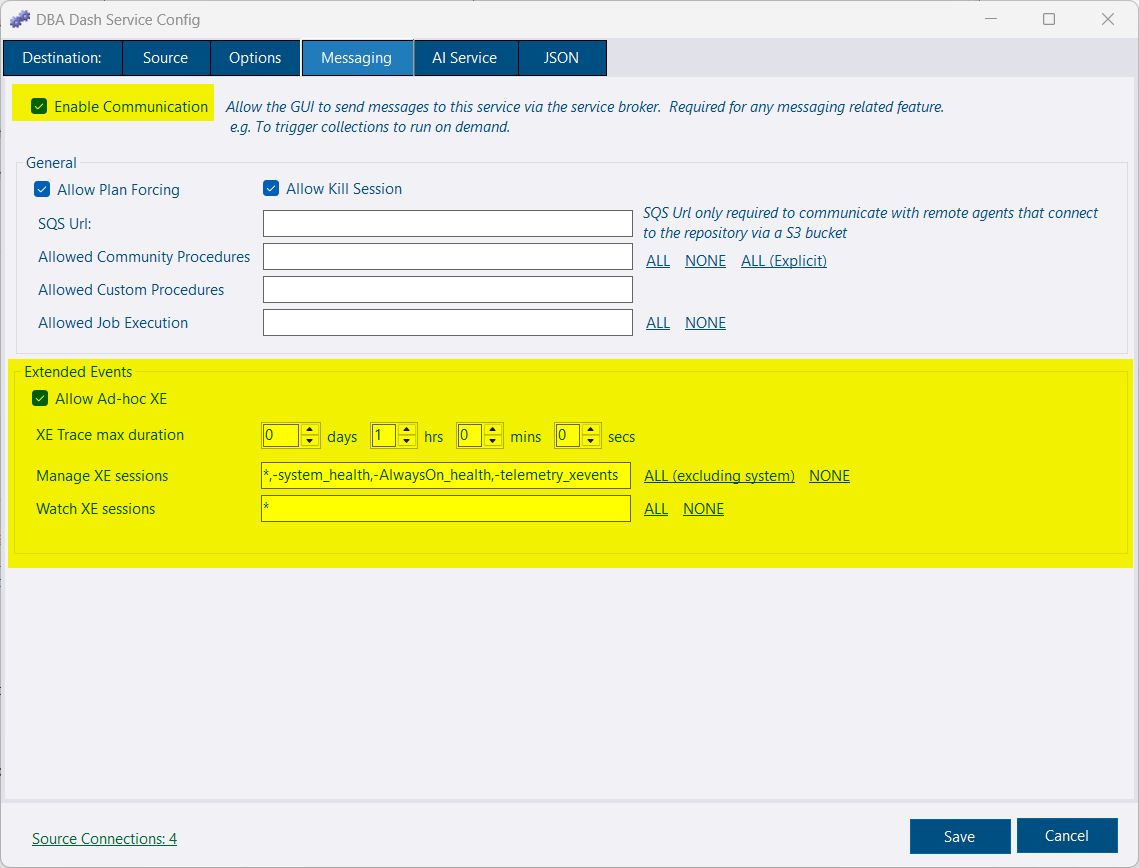
Only users with the appropriate roles in the repository database can run ad‑hoc XE sessions or manage/watch existing sessions.
db_owner (or sysadmin) — access by defaultOther users require:
AdhocXE — allows running ad‑hoc XE sessionsWatchXE — allows watching and viewing data for XE sessionsManageXE — allows starting/stopping existing XE sessionsThe application-level roles above are enforced by the application (a soft boundary). The Messaging role provides a stronger (hard) boundary; users without Messaging (or permissions that the role grants) cannot access messaging features in or outside of the application.
The service configuration must be enabled before any user can use Extended Events, regardless of repository role membership.