Title here
Summary here
The performance summary page allows you to see a summary of the health of your servers on a single page. You can see which servers are busy or might be experiencing performance issues.
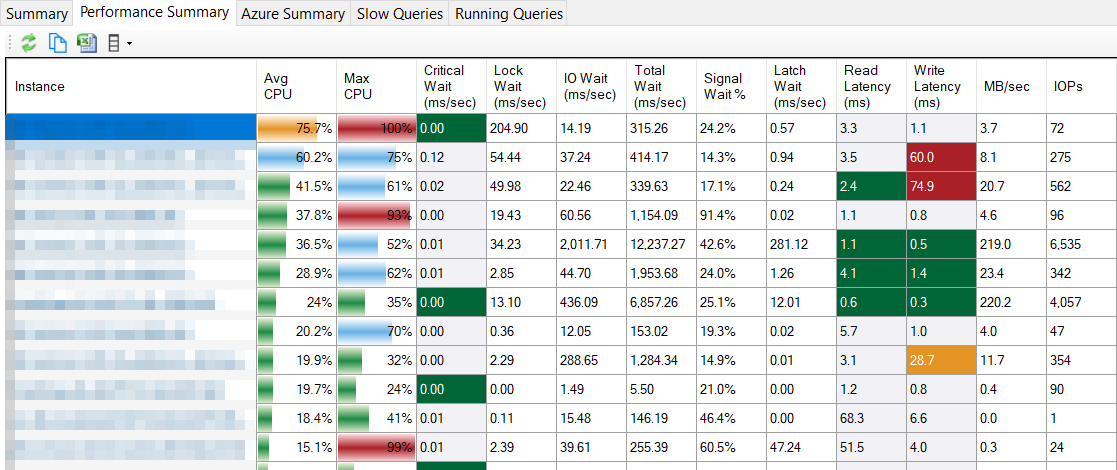
The CPU bar will highlight:
These thresholds can be modified in the dbo.Settings table.
Small amounts of certain wait types can indicate potential for serious performance problems. For example, RESOURCE_SEMAPHORE means you have queries queued waiting for a memory grant to execute. You can see the wait types defined as critical by running this query in the repository database:
SELECT WaitType
FROM dbo.WaitType
WHERE IsCriticalWait=1
Critical wait will highlight red at 1000ms/sec (CriticalWaitCriticalThreshold) and orange at 10ms/sec (CriticalWaitWarningThreshold). A true zero value will be green.
These thresholds can be modified in the dbo.Settings table.
Note: If the critical wait is grey rather than green it might be down to small amounts of THREADPOOL wait which can be ignored. Very small amounts of THREADPOOL waits are normal. This occurs when the instance requires more threads than are available in the thread pool and the pool needs to grow. THREADPOOL waits can indicate a serious performance problem if you have run out of threads and you will see more significant wait times for this wait type when it occurs.
Ideally disk latencies should be sub-millisecond or single digit millisecond. High disk latencies can indicate IO performance issues. High latencies might not be a big concern if there is very little IO happening on your system or if an IO related wait is not one of your top waits.
These thresholds can be modified in the dbo.Settings table.
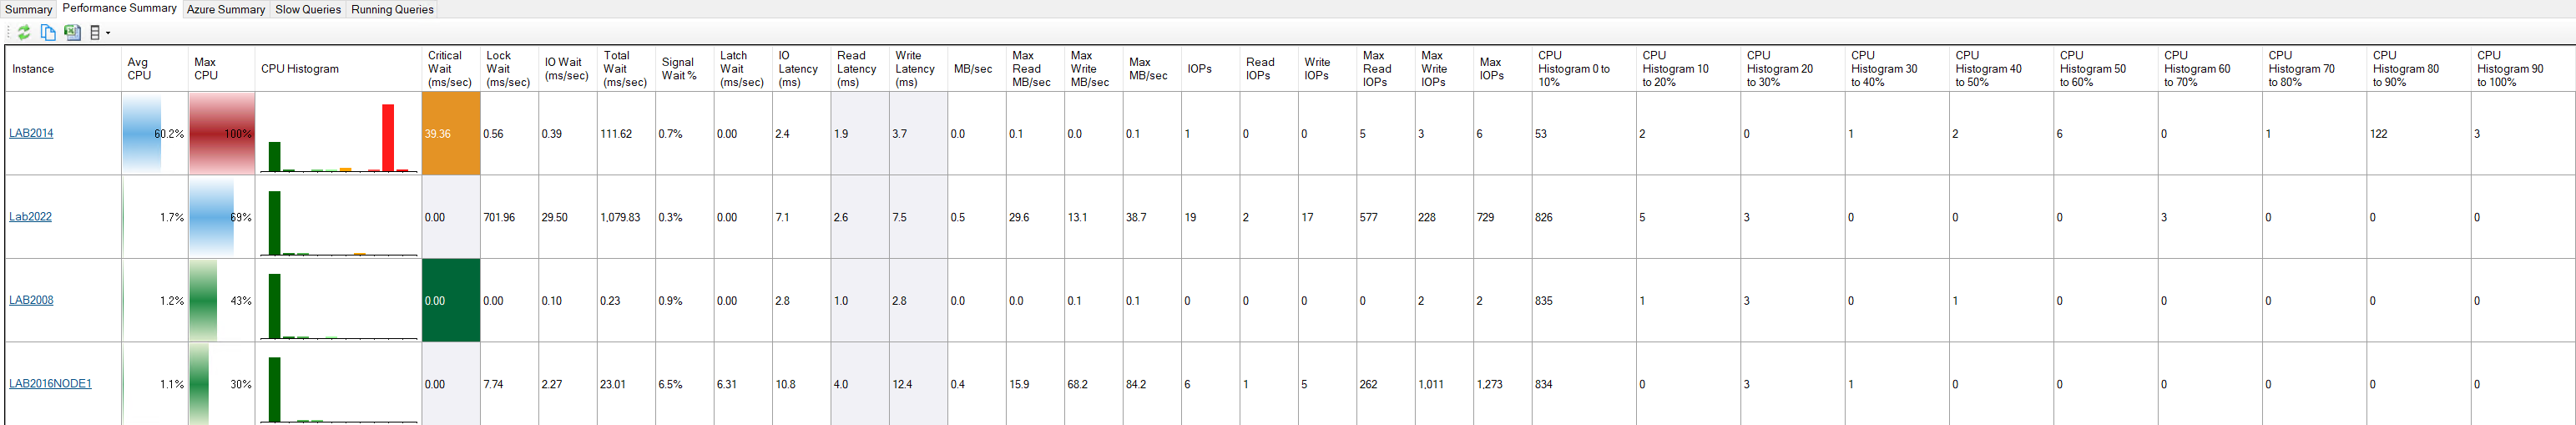
Additional columns are available by clicking the Columns button on the toolbar and selecting “Standard Columns”.

These columns include a CPU Histogram which shows how long the server has spent at particular CPU utilization levels.
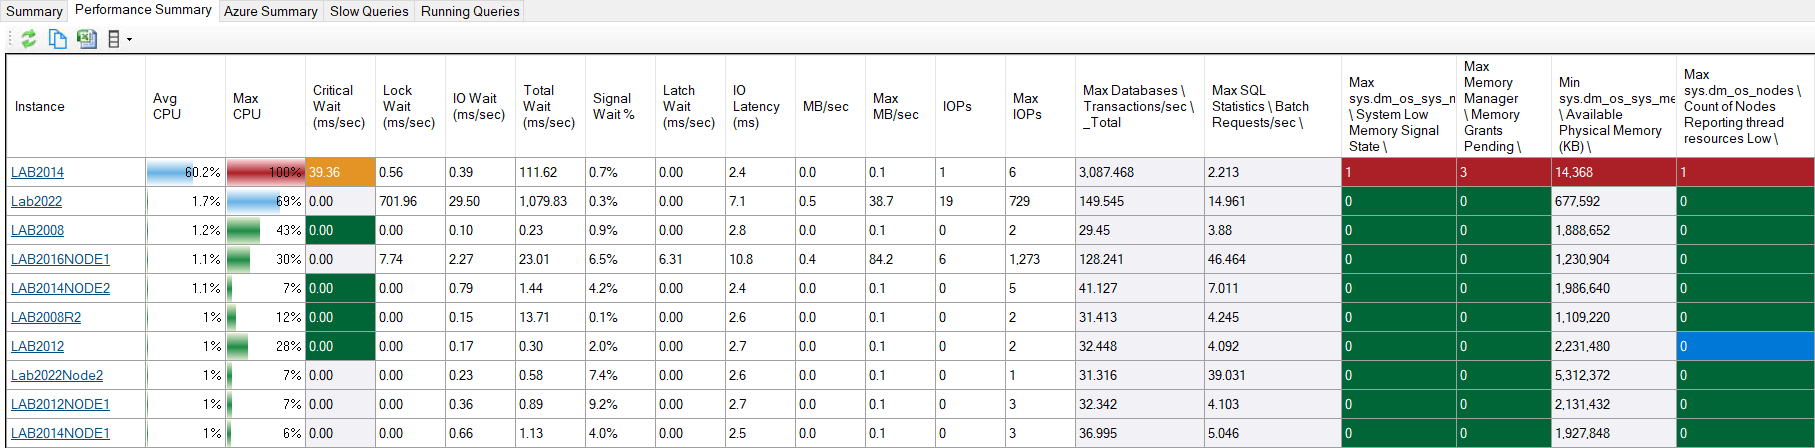
You can add any performance counter available in the “Metrics” tab to the performance summary. Click the Columns button on the toolbar and select “Performance Counter Columns”.
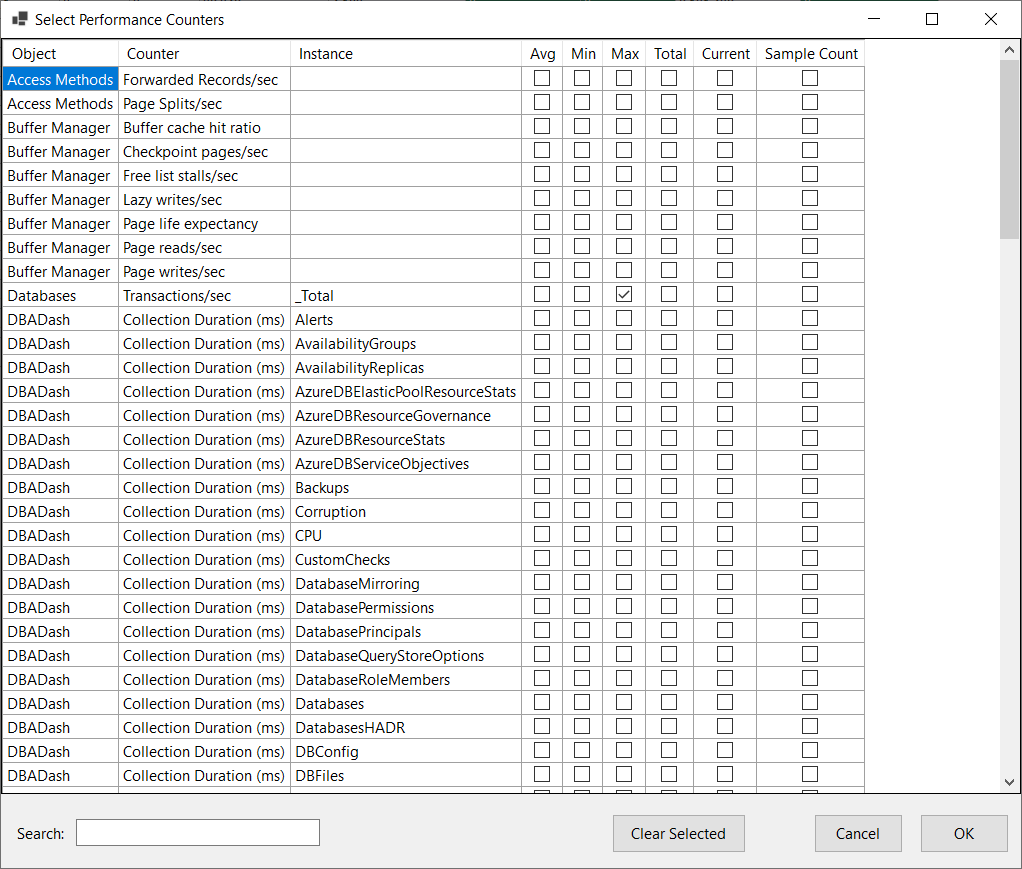
You can select the performance counters you are interested in and the type of aggregation to perform. The counters will then be available in the grid. Any highlighting configured on the “Metrics” tab will carry over to the performance summary.
The view can be reloaded by clicking the “View” menu next to the save icon.