Title here
Summary here
The query plan viewer is available in DBA Dash starting from 4.19.0. It’s also available without DBA Dash in the standalone DBA Dash Visualizer.
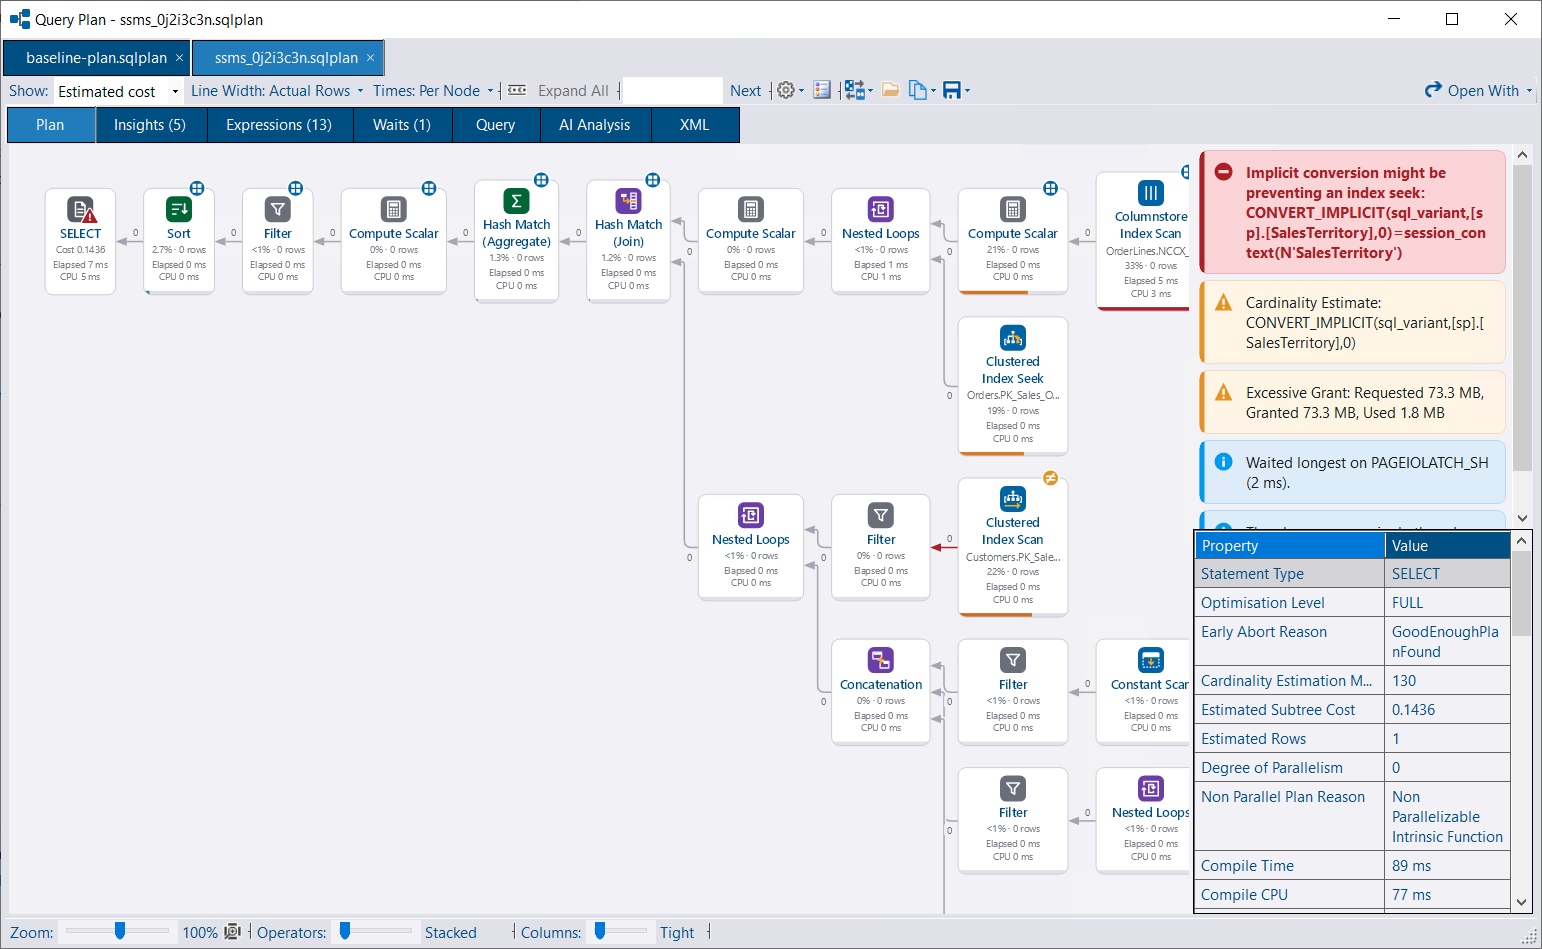
.sqlplan files onto the viewer window.Each plan opens in its own tab, so a fast run and a slow one can be compared side by side. Deadlock graphs open as tabs in the same window. Ctrl+W closes a tab.
DBA Dash can optionally register itself as a handler for .sqlplan files from the viewer’s Settings menu, in the same way as for .xdl files. This is opt-in and per user. When several files are opened at once from Explorer, they open as tabs in a single window.
The plan can still be opened in another application registered for .sqlplan files, such as SSMS, using the Open With button.
Bars and heat coloring on each operator can rank operators by:
Showplan only reports subtree costs, and a row mode operator’s time includes the time of everything feeding it. The viewer works out each operator’s own cost and time from its children’s figures. The operator with the highest estimated cost is often not the one that took the most time - switching between measures makes this easy to spot.
Arrow thickness can be based on rows or data size, using actual or estimated counts. Arrows are colored by how far the estimate was out.
Operators are badged for things worth a closer look:
Click Legend on the toolbar for an explanation of the badges, colors and other visual cues.
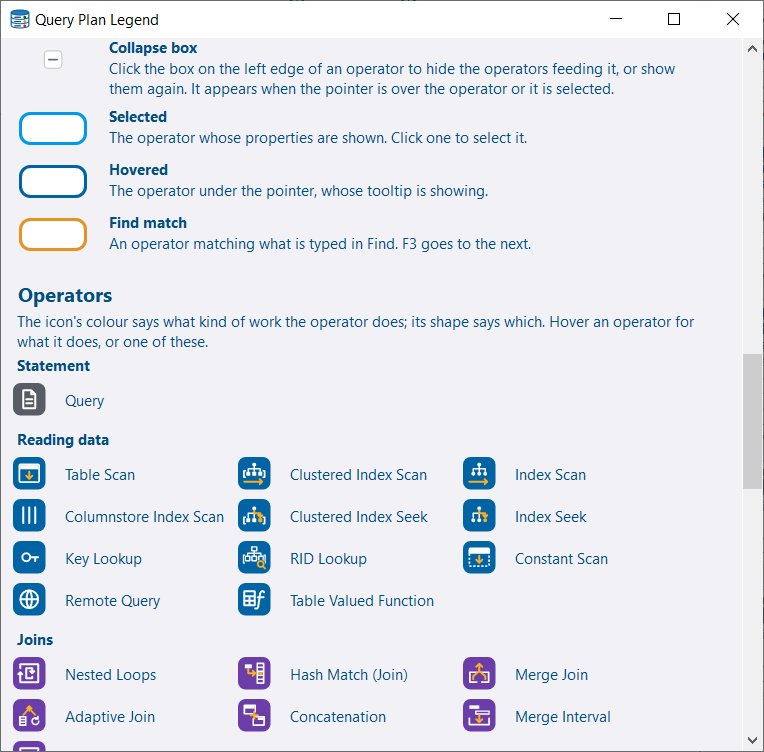
Choose the layout from Settings > Plan Shape (also on the right-click menu):
Line width, column spacing, operator descriptions and node IDs can also be adjusted from the Settings menu.
| Action | How |
|---|---|
| Zoom | Mouse wheel (zooms around the pointer) |
| Pan | Drag |
| Fit the whole plan in the window | 0 or Fit to Window |
| Move between operators | Arrow keys |
| Collapse / expand an operator’s inputs | Space |
| Find an operator, table, index, predicate or node ID | Ctrl+F, then F3 for the next match |
| Follow Data Path | Right-click an operator, or use the toolbar. Fades everything not on the path back to the root. Escape leaves it. |
Collapsed operators are shown as stacked cards with a count of the hidden operators. Expand All shows everything again.
A plan with several statements gets a statement selector above the graph. Statements can be ranked by cost, elapsed time or estimate error, making it easy to find the statement that matters in a large batch or procedure. Use Save As to save the selected statement as a .sqlplan file of its own.
Right-click a row in the statements grid to compare that statement with the one on screen, or to open it on a tab of its own. Compare > With Another Statement in This Plan lists every other statement.
| Tab | Contents |
|---|---|
| Plan | The graph, plus the selected operator’s properties and insights |
| Insights | Plan warnings from SQL Server and DBA Dash’s own insights, worst first, each linked back to its operator |
| Operators | Every operator in the plan listed in a grid, with a link back to its place on the chart |
| Missing Indexes | Missing index requests with a CREATE INDEX statement |
| Expressions | Computed expressions and where they are worked out |
| Parameters | Compiled and runtime values, scriptable as DECLARE statements |
| Waits | Wait stats from an actual plan, with a link to what each wait type means |
| Query | The statement text and the SET options |
| AI Analysis | Optional AI-driven analysis (DBA Dash only - not available in the Visualizer) |
| XML | The raw plan XML |
Tabs are hidden when there is nothing to show.
The operator properties include the memory grant for each operator (memory fractions and per-thread input/output/used memory), so it’s clear which operators the grant went to. Estimated Available Memory Grant, Max Compile Memory and Estimated Pages Cached are formatted under Optimizer Hardware Dependent Properties the way SSMS shows them. Where SQL Server’s memory grant feedback has resized the grant, the adjusted and originally estimated values are both shown, so a resized grant isn’t mistaken for the optimizer’s estimate.
A statement’s Query Hash and Query Plan Hash properties open the detail window when the plan was opened from DBA Dash: Query Stats, Running Queries and Query Store for that hash. The standalone Visualizer has no repository to look them up in, so these stay as plain text there.
Insert, update and merge operators show their set predicate in the properties panel, the tooltip and search. A MERGE labels each predicate with its action. Seek predicates are shown for clustered index update and delete, including operators that hold the predicate directly.
The Copy menu can copy the whole plan or the current view as an image, the plan XML, the query text, the operator properties, the missing index T-SQL, or the parameters as DECLARE statements.
Save As saves the whole plan, the selected statement, or an image of the plan.
Similar to the deadlock viewer’s findings, the plan viewer performs static analysis of the plan. No AI service is required and nothing leaves your environment. Examples include:
RESOURCE_SEMAPHORE queuing.WHERE (col = @p OR @p IS NULL), col = ISNULL(@p, col) or col = COALESCE(@p, col) without OPTION (RECOMPILE). One cached plan can’t seek on these conditions. The insight lists the fixes and their costs: OPTION (RECOMPILE) (showing this plan’s compile CPU next to its run CPU), dynamic SQL with sp_executesql, or SQL Server 2025’s optional parameter plan optimization. Plans already compiled by SQL Server 2025 as optional parameter variants are reported as information.DATETIME against a DATETIME2 partition function, or DATETIME2(7) against DATETIME2(3).STRING_SPLIT, OPENJSON and the DMVs are named, with the one whose estimate was furthest out called out.The Insights tab lists these alongside the warnings SQL Server includes in the plan. The Source column shows whether each one came from SQL Server or DBA Dash - the DBA Dash insights won’t appear in SSMS.
Use the Compare menu on the toolbar to compare the current statement with:
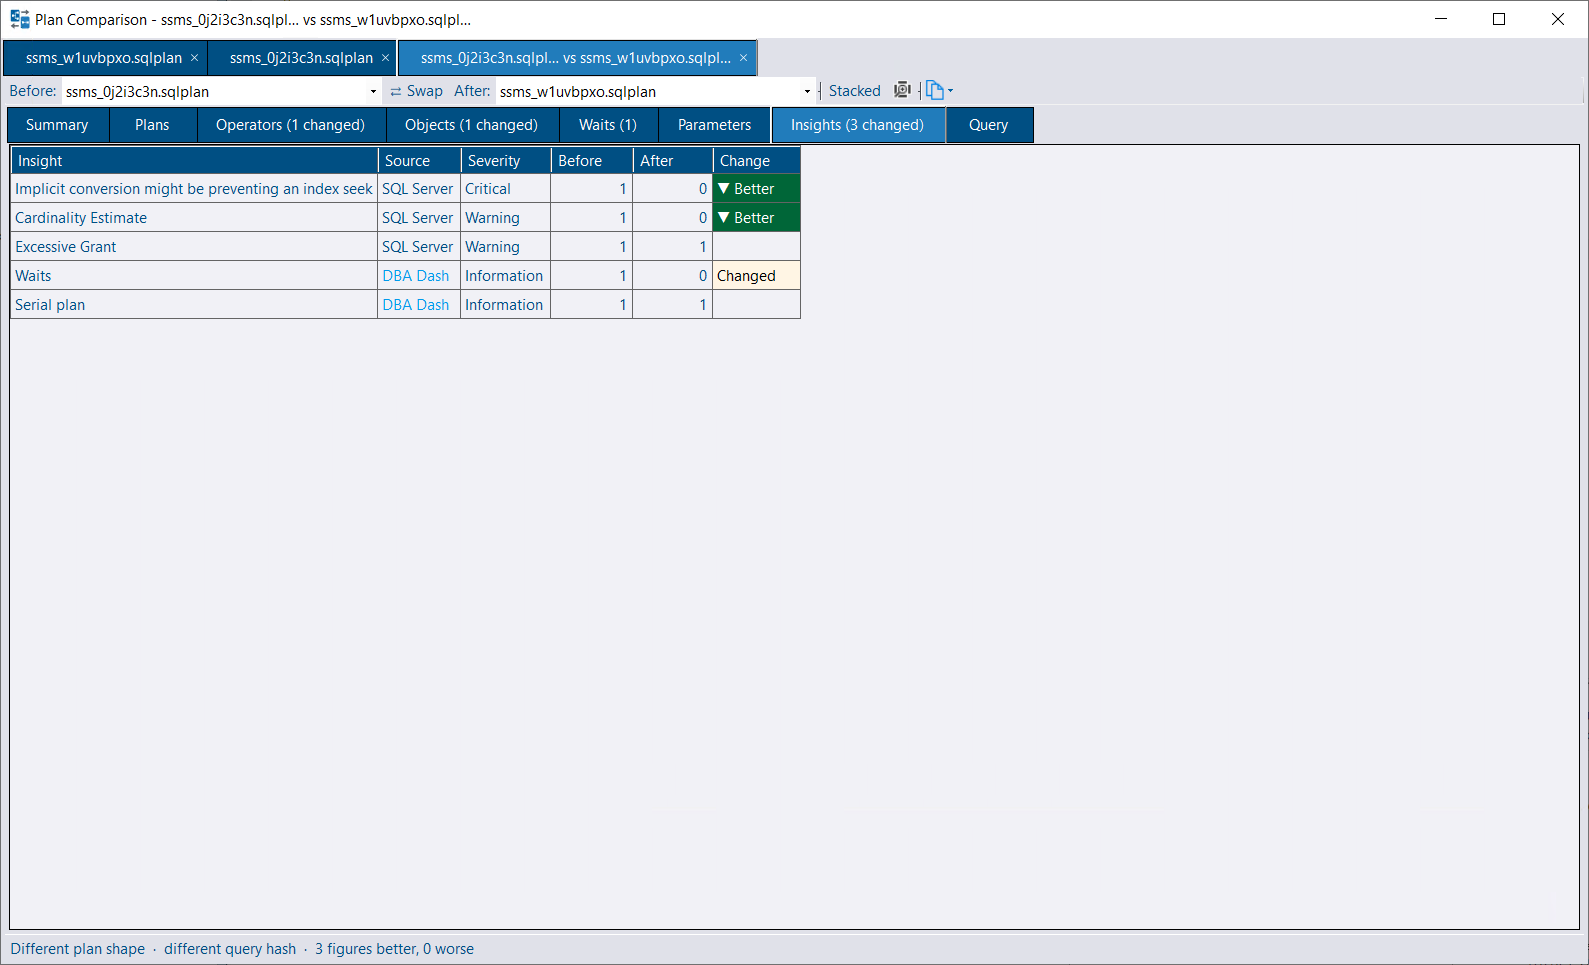
The comparison opens in its own tab. Use the Before and After drop-downs to switch either side to any statement of any open plan, or click Swap.
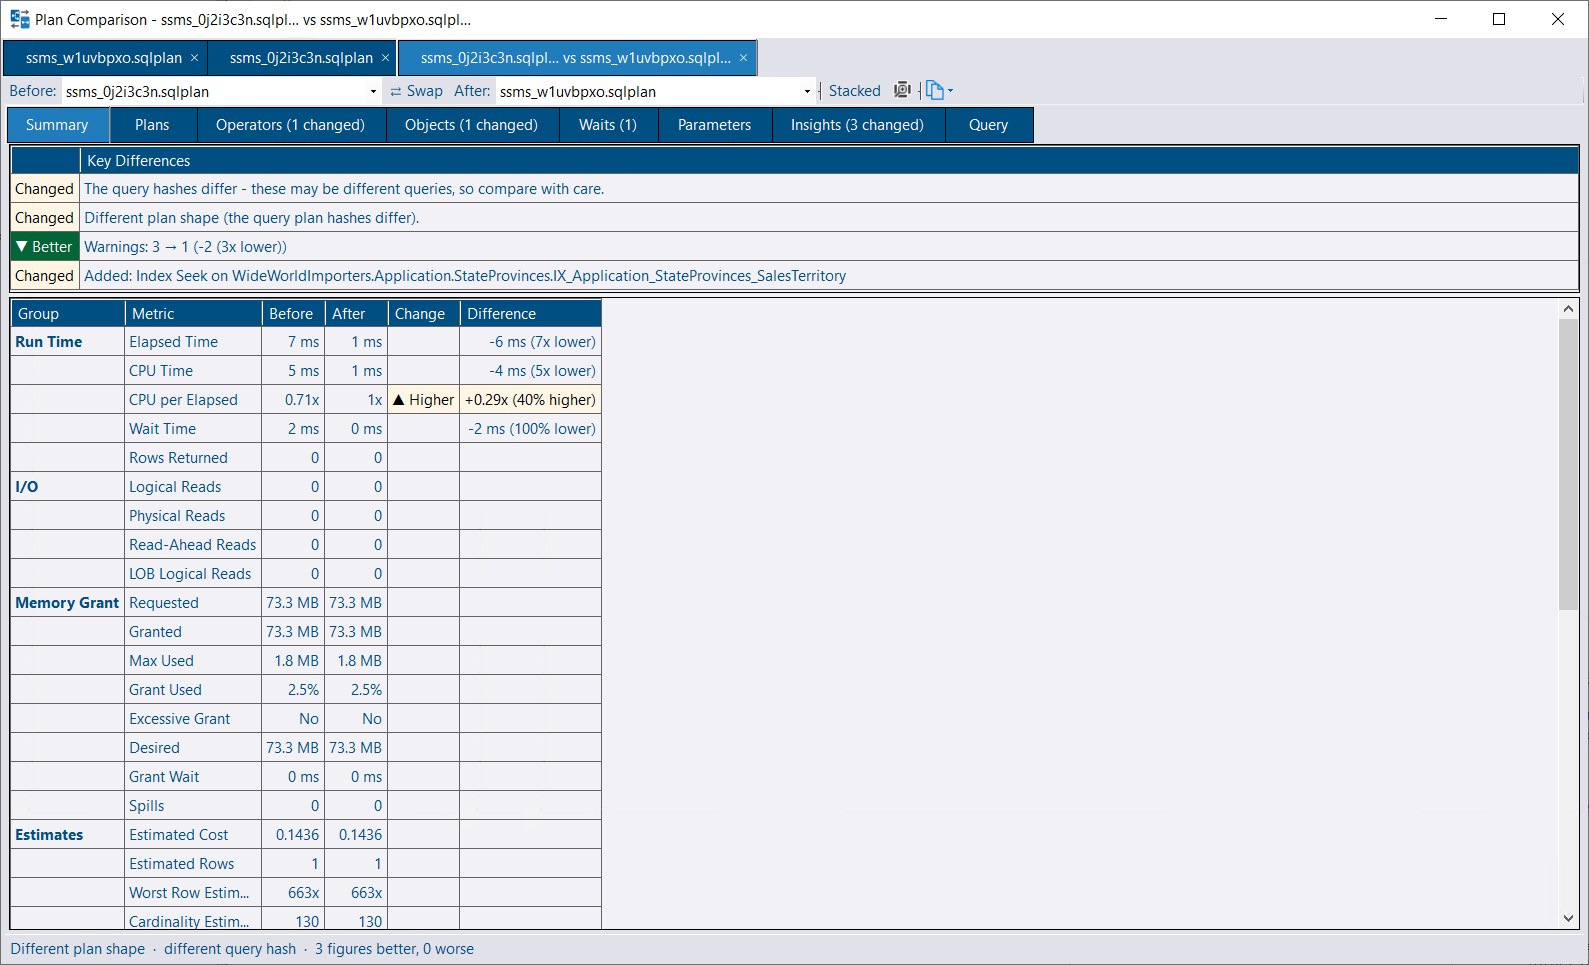
The summary starts with the Key Differences, followed by statement-level figures grouped by run time, I/O, memory grant, estimates, parallelism, plan shape and compilation. Each change is marked as better or worse, depending on which direction is better for that figure.
The status bar summarizes the comparison - e.g. whether the plan shape and query hash differ, and how many figures are better or worse. Use the copy button to copy the summary as text.
If the query hashes differ, the plans may be for different queries, so compare with care.
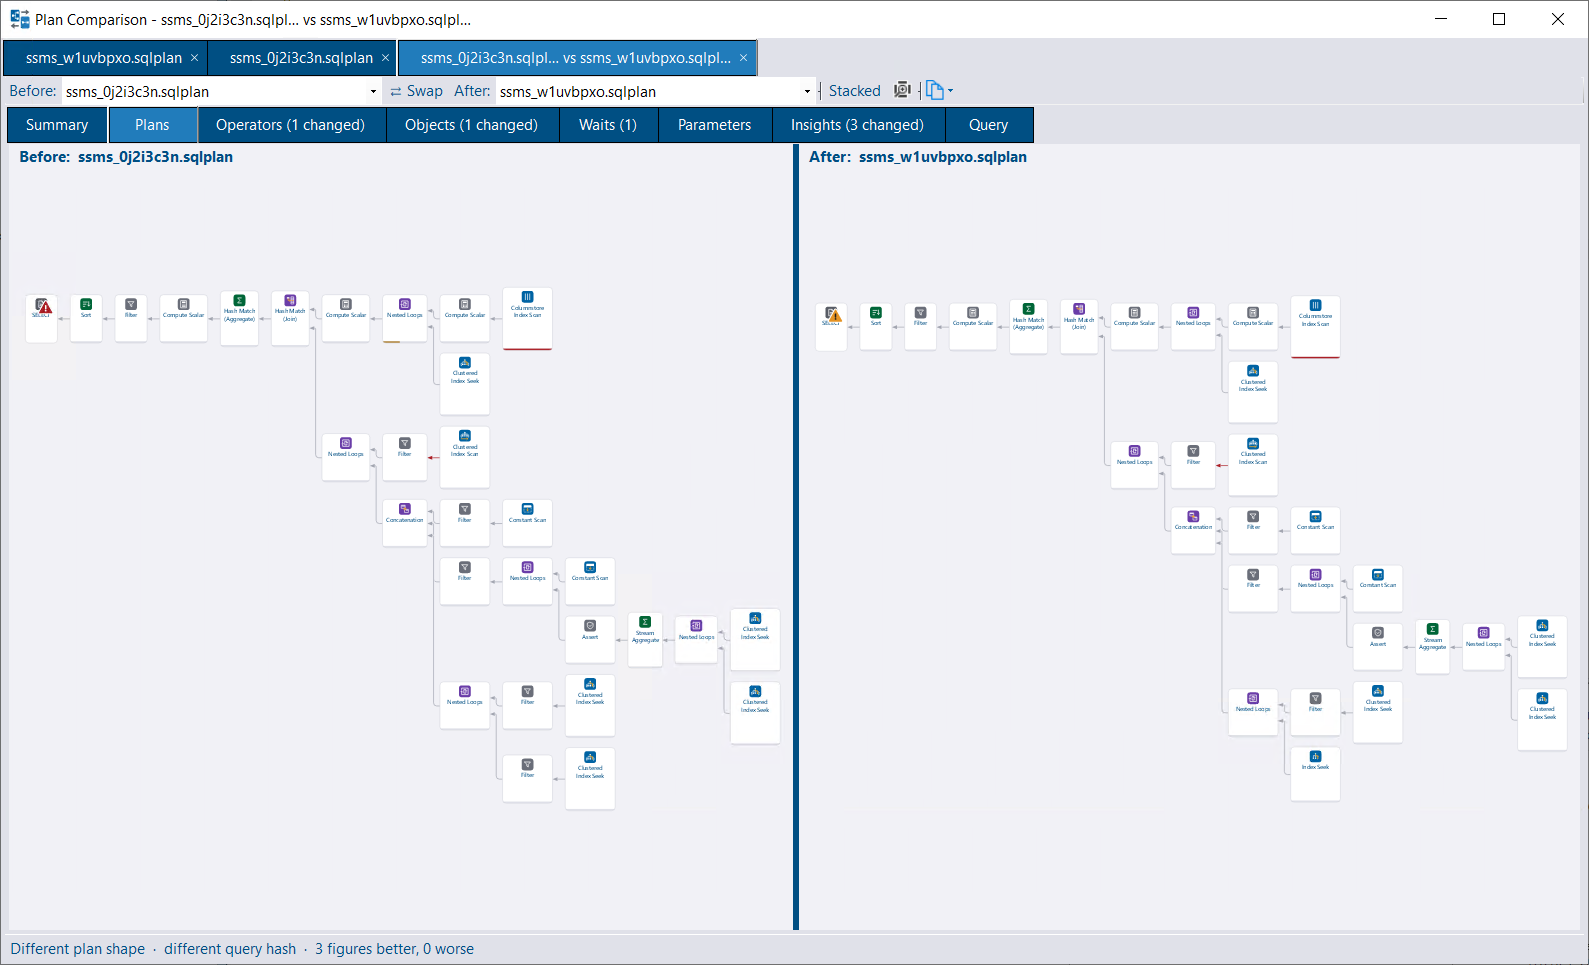
The two plans side by side, or stacked if you click Stacked. Selecting an operator in one plan selects the matching operator in the other.
| Tab | Contents |
|---|---|
| Operators | Operators grouped by type. Operators are grouped rather than paired, as pairing is unreliable once the plan shape changes |
| Objects | Objects grouped by table, index and access method |
| Waits | Wait stats from each plan |
| Parameters | Parameter values, including the sniffed compiled values |
| Insights | SQL Server warnings and DBA Dash insights for each plan |
| Query | A side-by-side diff of the query text |
Tab captions show the number of changes, e.g. Operators (1 changed).
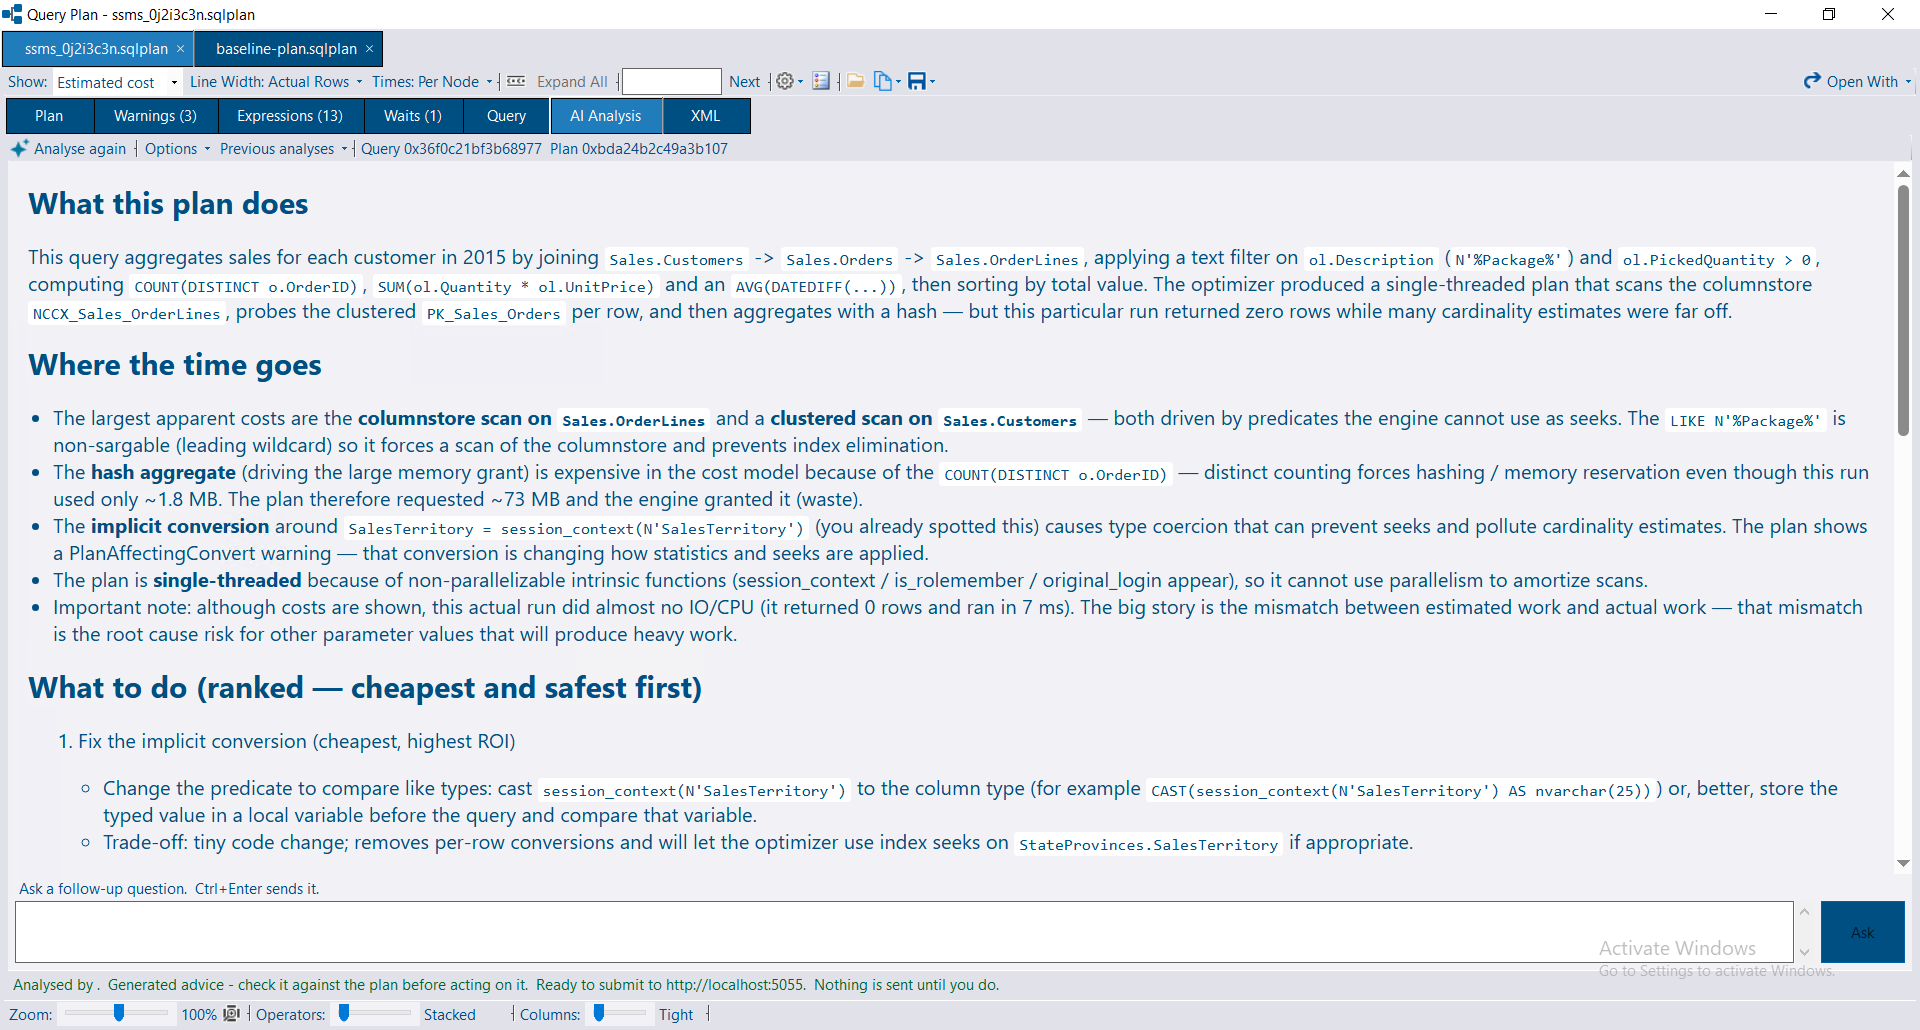
With the AI Assistant service configured, the AI Analysis tab can send the plan for detailed observations and recommendations.
For providers that accept a model per request (Anthropic, Amazon Bedrock and Ollama), an Options > Model menu lists the configured default plus whatever models the service reports as available, so you can pick a different model for an analysis without changing the server-side configuration. The choice is shared with the deadlock viewer for the rest of the session.
Nothing is sent until you press Submit for analysis, and the exact request is shown first. Read it before pressing send - plans can include parameter values and literals.
The analysis is scoped to the selected statement. Along with the plan XML, the request includes what the viewer already knows: insights, missing indexes, waits, parameters, and the operators ranked by their own cost.
Plans can be very large. For a plan over 512 KB, the XML is excluded by default and only the summary is sent. You can choose to include it - the size is shown in tokens as well as bytes, as tokens are what a model’s context limit is measured in. There is a hard limit of 2 MB.
Analyses are stored against two identities:
An answer about the plan on screen is shown first. Previous analyses are available from the drop-down, including answers about a different plan for the same query. This can be useful when investigating a plan regression, but a conversation about a different plan can’t be continued from this plan.
If the plan doesn’t include a query hash or query plan hash, the viewer computes its own. A computed identity only matches another computed identity.
You can ask follow-up questions to continue the conversation. The initial analysis is stored in the repository database and shared with other users. Your follow-up questions and answers are private to you - see AI conversations.