Title here
Summary here
The SSMS extension is available starting from 4.20.1. It supports SSMS 21 and 22.
The extension adds an Open in DBA Dash Visualizer option to SSMS for:
sp_BlitzLock.The option is also on the Tools menu, with Ctrl+Alt+Shift+D as a keyboard shortcut.
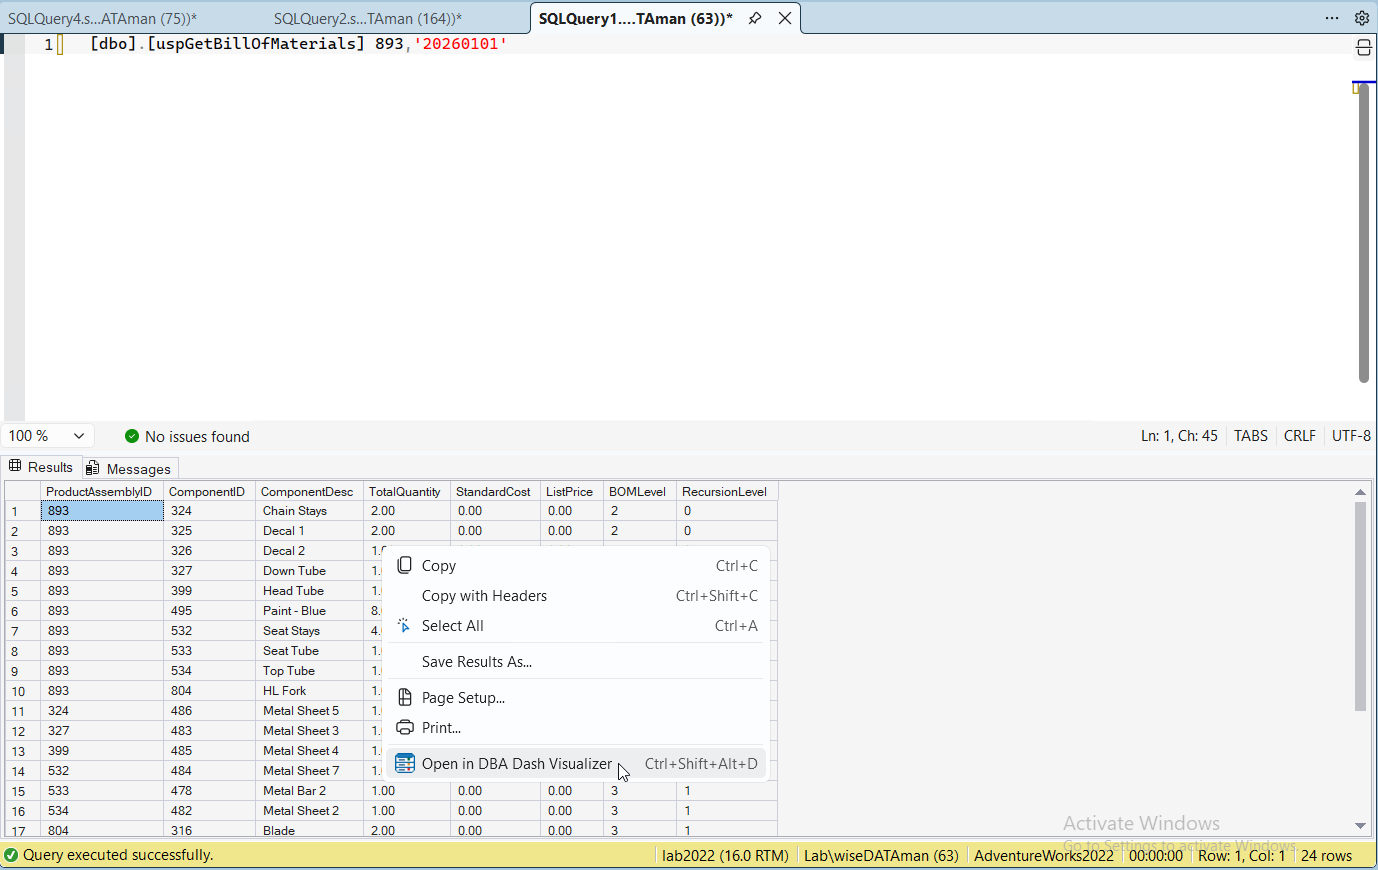
Items open in DBA Dash Visualizer. If the Visualizer isn’t installed, they open in DBA Dash instead.
The extension is included with DBA Dash and DBA Dash Visualizer - there’s nothing separate to download.
The extension is installed with the SSMS VSIX installer. Close SSMS if prompted, and start it again once the install completes. Installing also records the path of the app it was installed from, which the extension uses to launch the viewer.
If the installed extension is older than the app, you’ll be offered an update. Use Uninstall SSMS Extension… from the same menus to remove it.
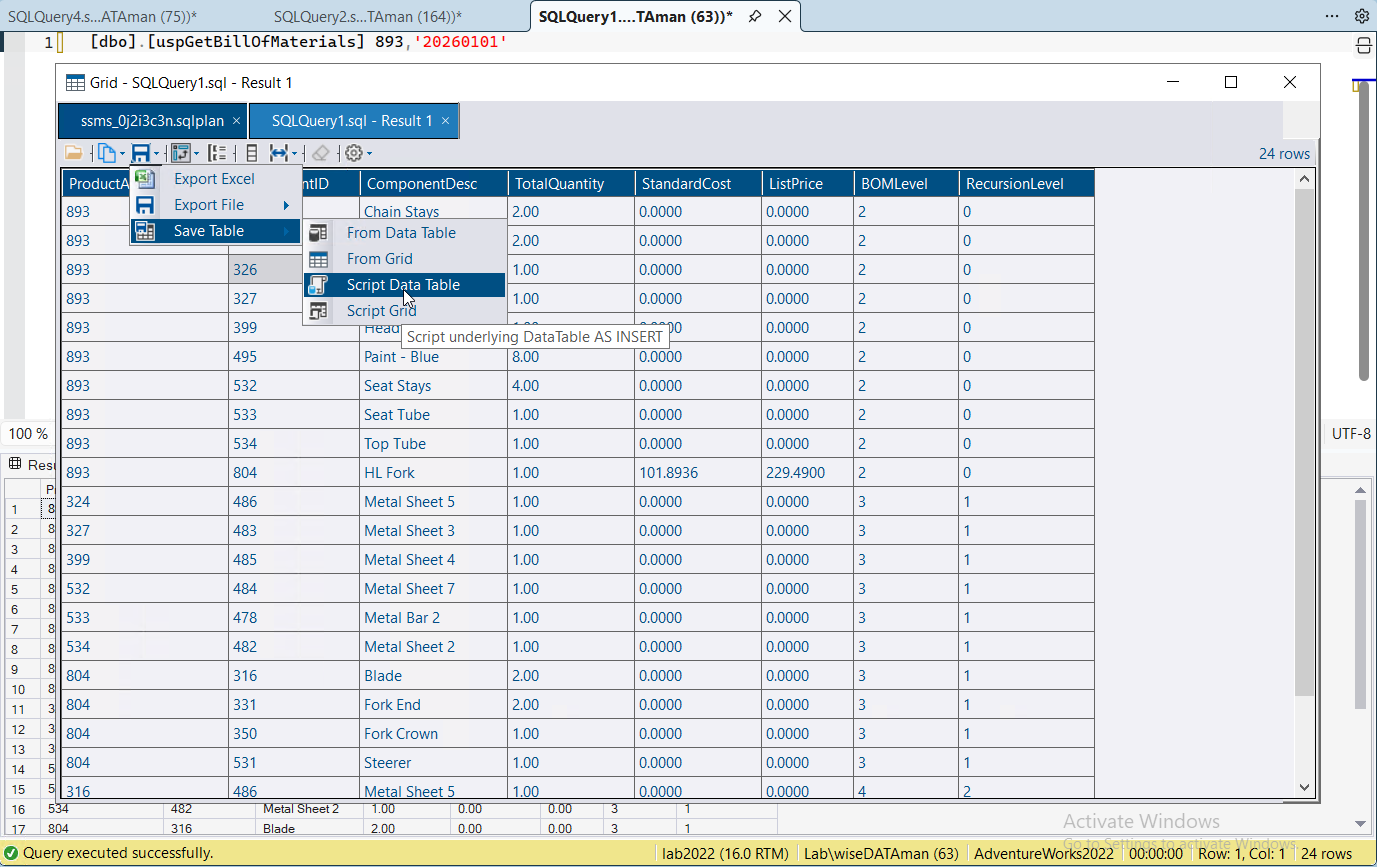
Opening an SSMS results grid in the Visualizer gives you features that aren’t available in SSMS:
Column data types are preserved when the grid is read from SSMS. Large result sets are read in the background with a cancellable progress dialog.
Open All Results in DBA Dash Visualizer sends every result set from the query window in one go. They open on a single tab, named after the query window, with a table per result set. Save All saves them as a data set file (XML or JSON) that can be re-opened later, or as an Excel workbook with a sheet per result set.
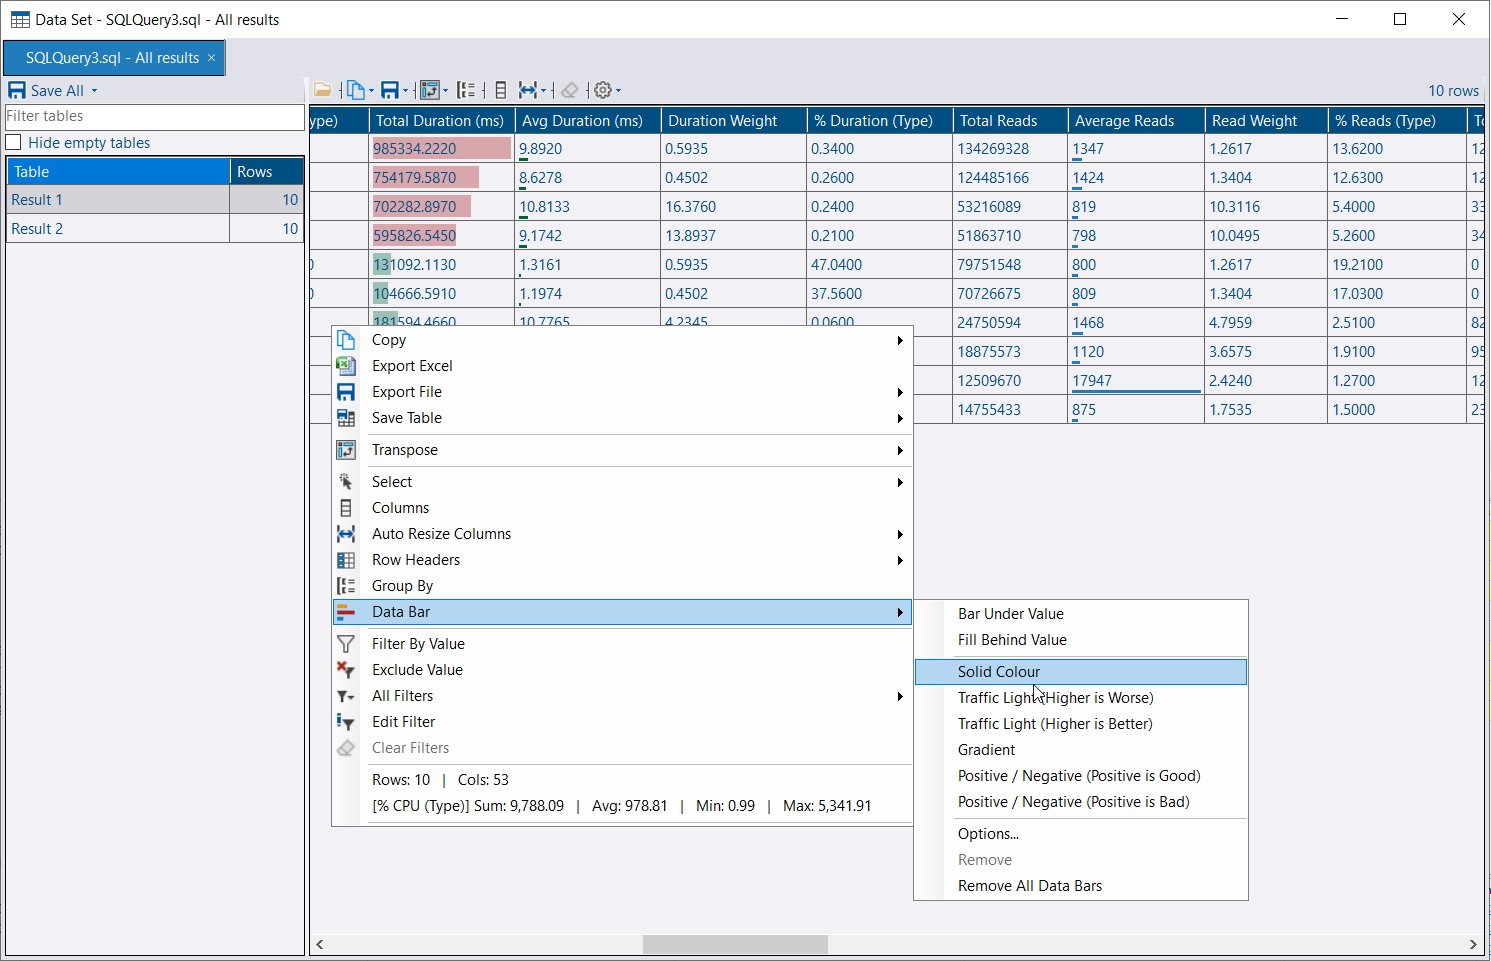
Right-click a numeric column or cell and select Data Bar to draw a bar in each cell, sized by the value’s share of the column’s range.
By default, a bar is scaled to the values showing, so it rescales when you filter, group or refresh. Data bars are remembered and re-applied to the next result set with the same column names and types.
Data bars are available in grids throughout DBA Dash, not just result grids. They can also be saved with custom reports.
Right-click the grid and select Save Table:
| Option | Description |
|---|---|
| Script Grid | Script the visible columns, using the grid’s column headers |
| Script Data Table | Script all the underlying columns |
| From Grid / From Data Table | Save directly to a table in a SQL Server database |
The script creates a #DBADashGrid temp table, inserts the rows (in batches of 1,000), and selects them back. Rows are filtered the same way as the grid.
IF OBJECT_ID('tempdb..#DBADashGrid') IS NOT NULL
BEGIN
    DROP TABLE #DBADashGrid
END
GO
CREATE TABLE #DBADashGrid (
    ...
);
INSERT INTO #DBADashGrid (...)
VALUES (...),
(...);

SELECT ...
FROM #DBADashGrid
Run the script in SSMS to re-create the results you saw in the grid, then query the temp table to slice the data further. This is useful for sharing a result set with someone else, or for keeping a copy of it to compare against later. Export File > As SQL (INSERT) saves the same script to a file.
Export File saves the grid as JSON or XML (optionally compressed), which can be re-opened later in the Visualizer or in DBA Dash with Tools > Open Grid or Data Set. Results saved from SSMS with Save Results As XML can also be opened - by drag and drop, from Explorer, or with the Open button. Tools > Open Grid or Data Set in DBA Dash also opens DataSets written to the DBA Dash service’s Failed folder, which can help with troubleshooting collection issues.
The extension writes the plan, deadlock graph or grid data to a randomly named temp file and launches DBADashVisualizer.exe (or DBADash.exe). It finds the app by checking, in order:
PATH.SSMS doesn’t provide a supported API for reading execution plans, deadlock graphs or results grids. The extension relies on SSMS internals, so a future SSMS update could break some of these options until the extension is updated. If the data can’t be read, a warning message is shown.