Title here
Summary here
April 7, 2025 in Releases by David Wiseman2 minutes

Availability Group monitoring & alert improvements
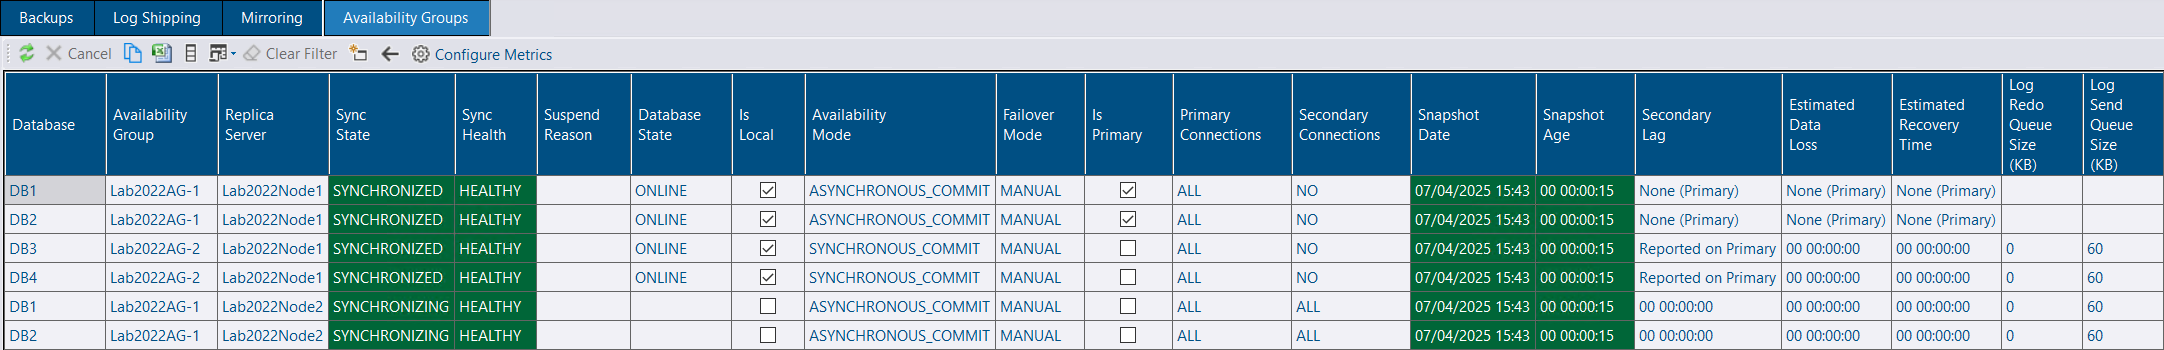
Additional metrics are now available to track availability group performance.
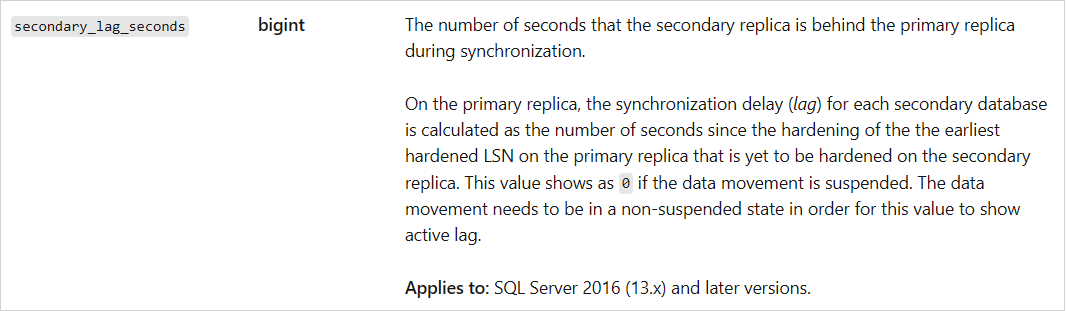
Additional columns from sys.dm_hadr_database_replica_states are available for selection (click the columns toolbar button)
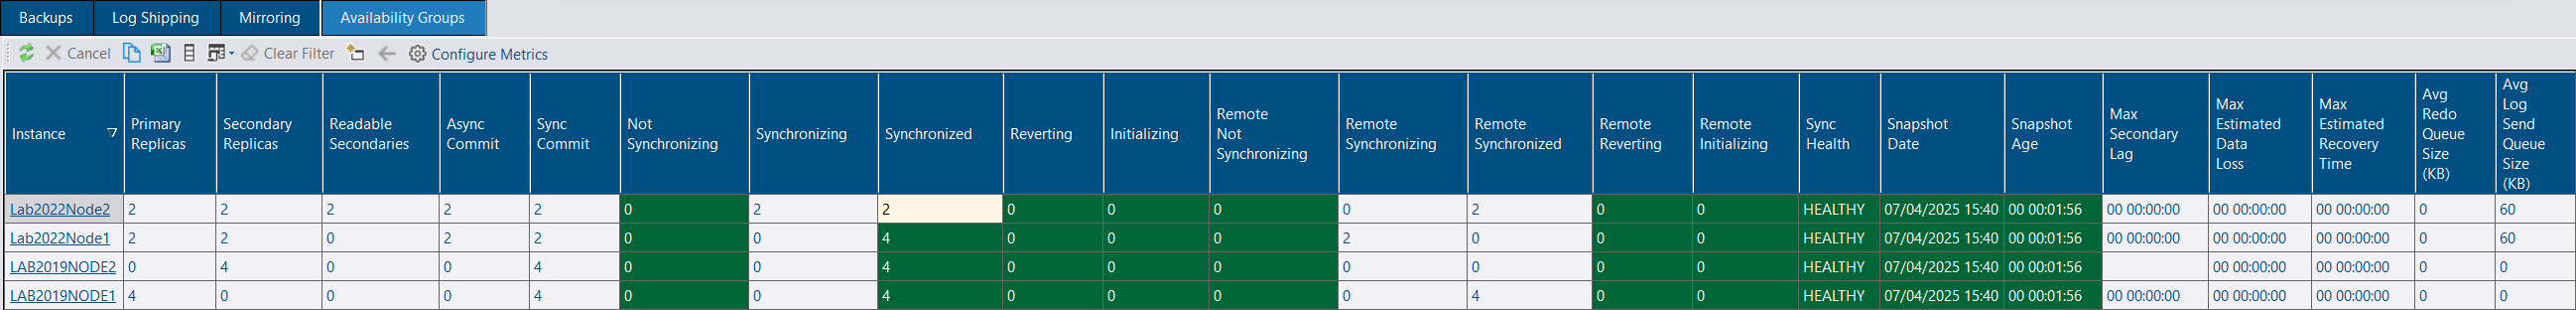
At the summary level, the aggregate values (current) are shown across all databases.
You can configure which Availability Group metrics are tracked over time by clicking Configure Metrics. Metrics will be Available on the Metrics tab.
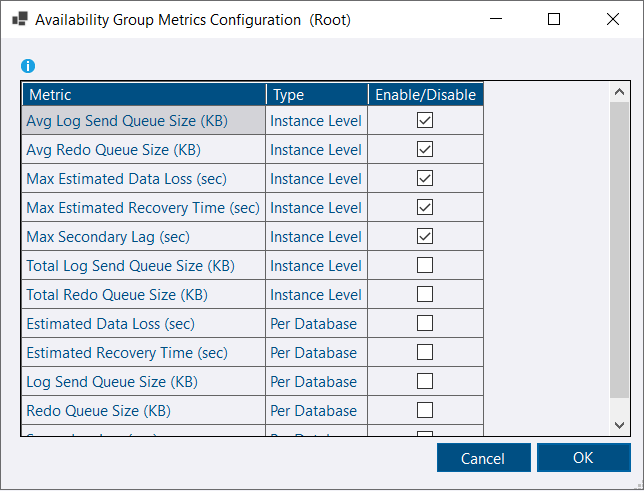
If you enable per-database metrics this will result in a large number of additional performance counters being tracked.
The following metrics are tracked by default which are available as performance counters on the Metrics tab:
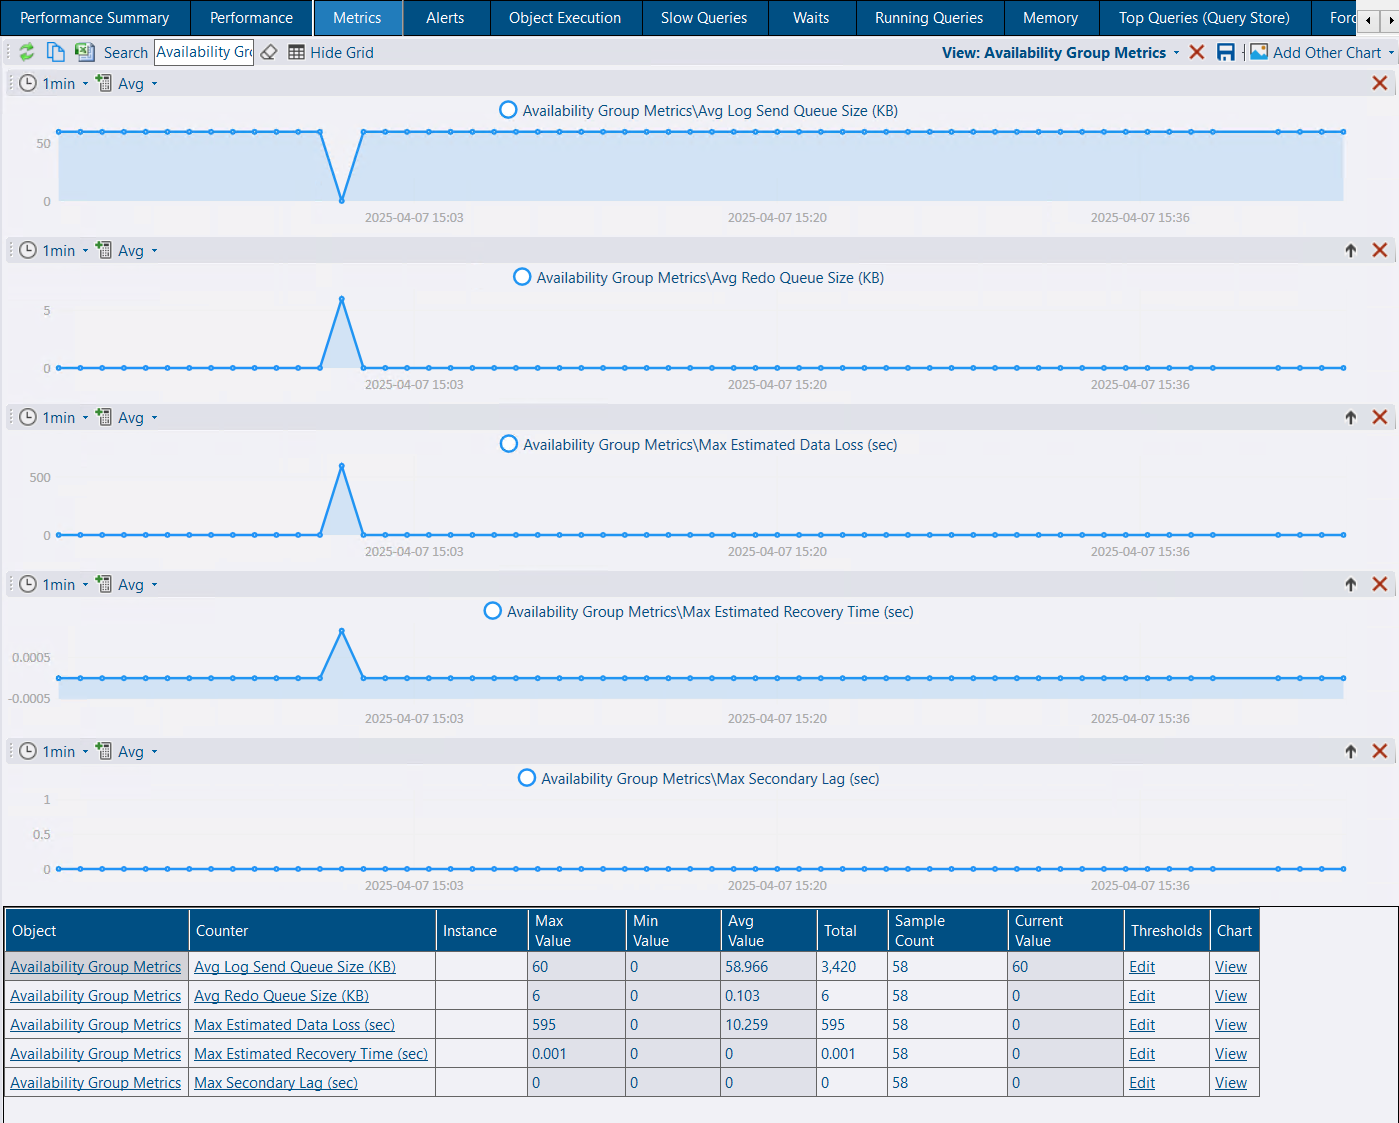
Alerts are available for performance counters, including the new Availability Group Metrics performance counters.
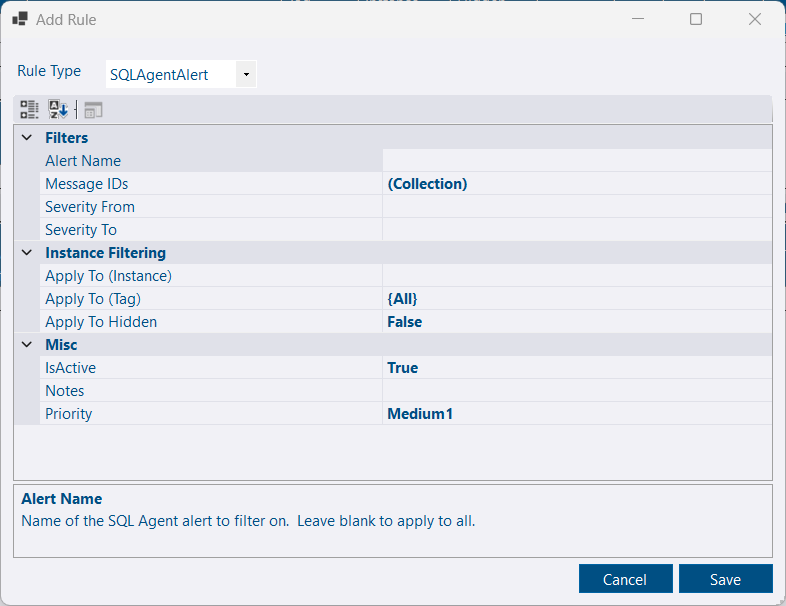
SQL Agent alerts can be created for a variety of error and performance conditions. A rule is now available in DBA Dash for SQL Agent alerts. SQL Agent alerts can notify you directly via email. You can now also be notified via the DBA Dash alert system which has Desktop notifications, Slack, PagerDuty & Webhook options (e.g. Google Chat).
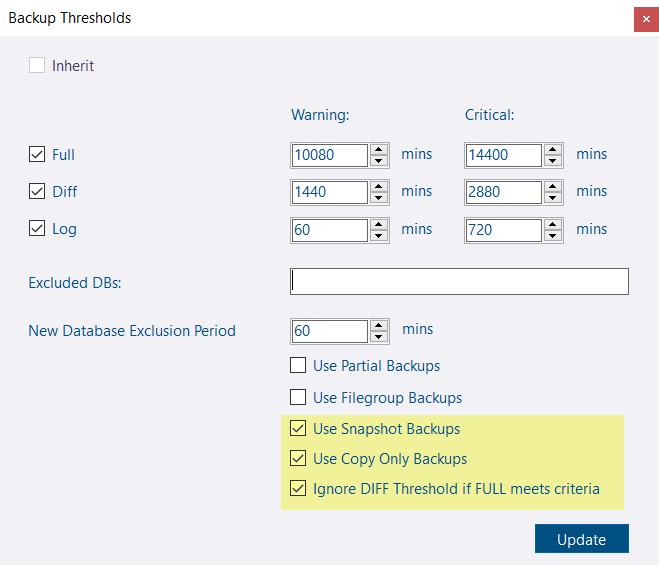
Some new options are available:
See 3.20.0 release notes for a full list of fixes.