Title here
Summary here
DBA Dash is a tool for SQL Server DBAs to assist with daily checks, performance monitoring and tracking configuration changes.
Get Started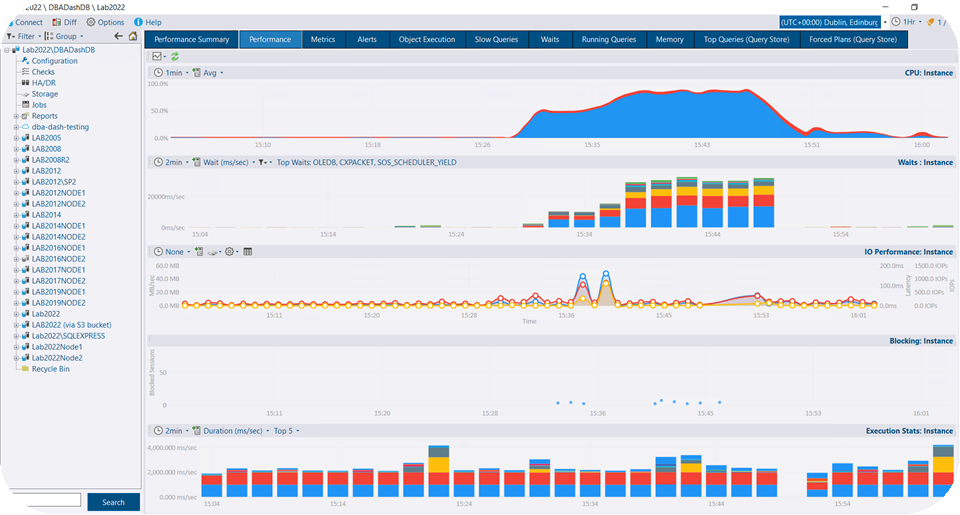
Monitor CPU, IO, blocking, running queries, slow queries, stored procedures, performance counters, memory & more.
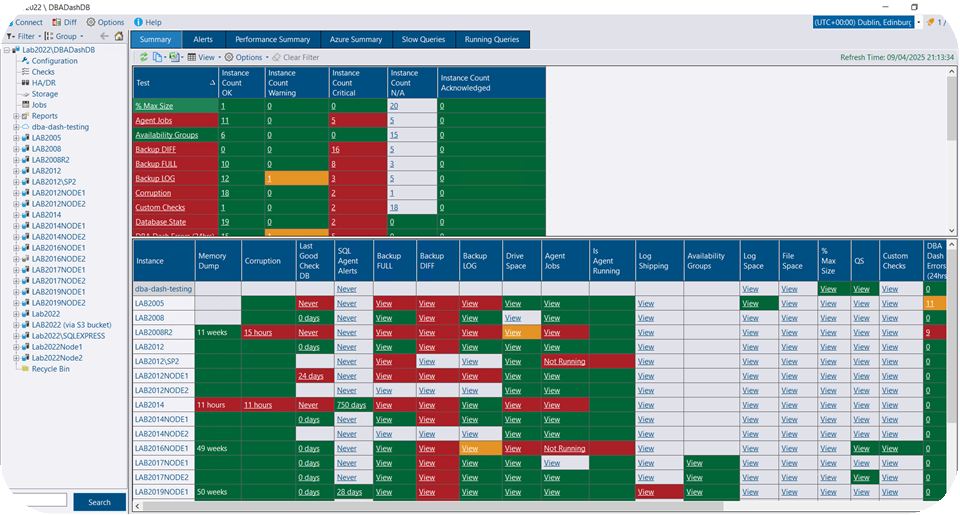
Check backups, corruption, memory dumps, DBCC, availability groups, log shipping, mirroring, agent jobs, disk space, query store, identity columns & more.
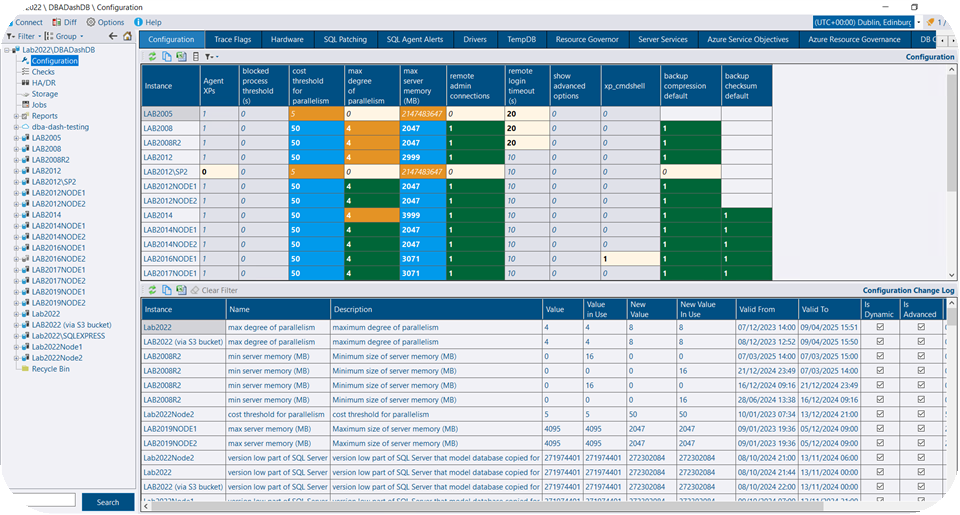
Check configuration settings, trace flags, hardware, patching & tempdb across all servers. Automatically track when changes occur.
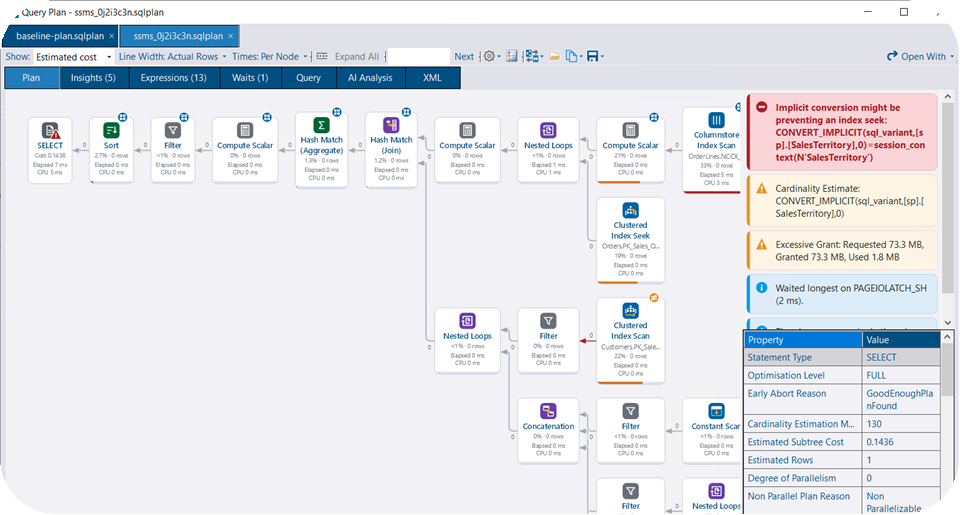
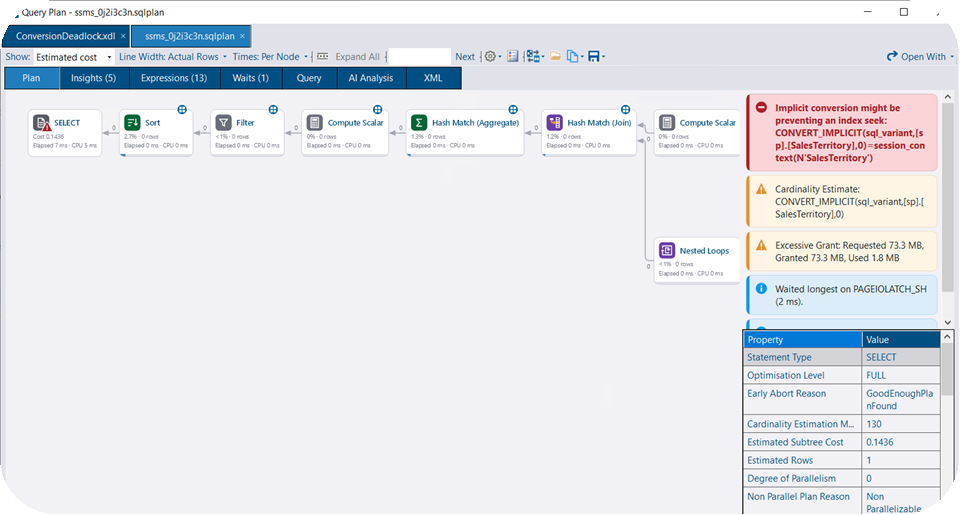
Rank operators in an execution plan by cost, CPU, elapsed time, reads or estimate error. Warnings, bad estimates and missing indexes are called out.
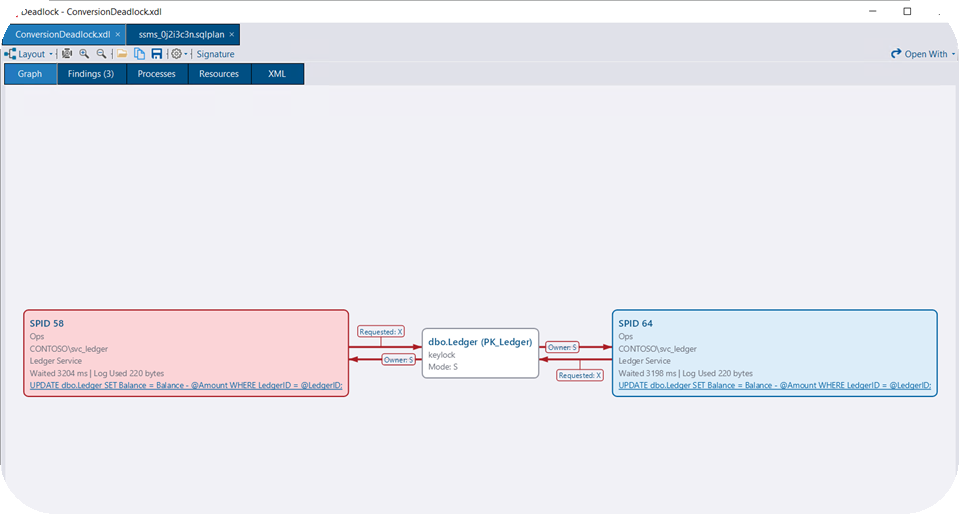
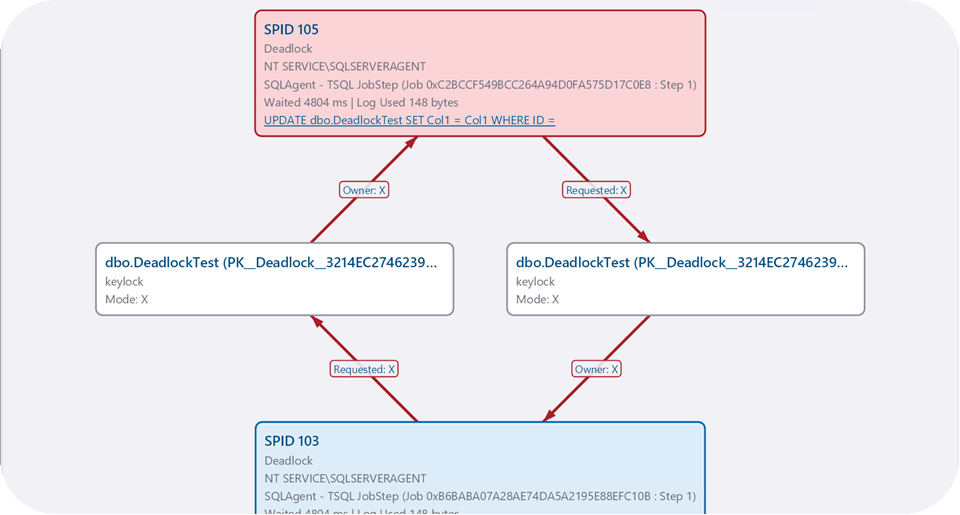
Capture and visualize deadlocks. Also view blocking chains captured from running query snapshots.
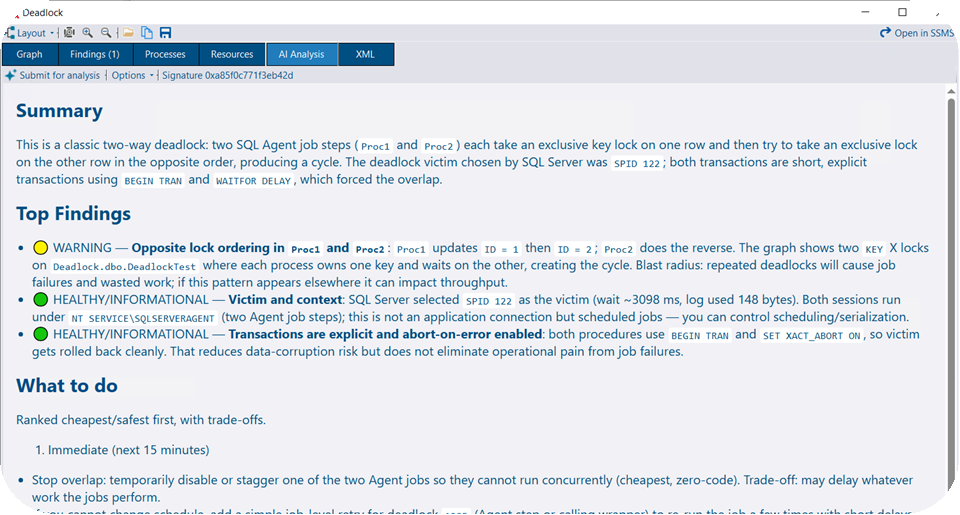
Optional AI assistant for questions about your environment, and analysis of performance, execution plans and deadlocks.
A standalone app with the same plan and deadlock viewers. Open a .sqlplan or .xdl file with no repository, service, or SQL Server connection. SSMS extension included for integration with SQL Server Management Studio.