Screenshots 📷
Daily Checks
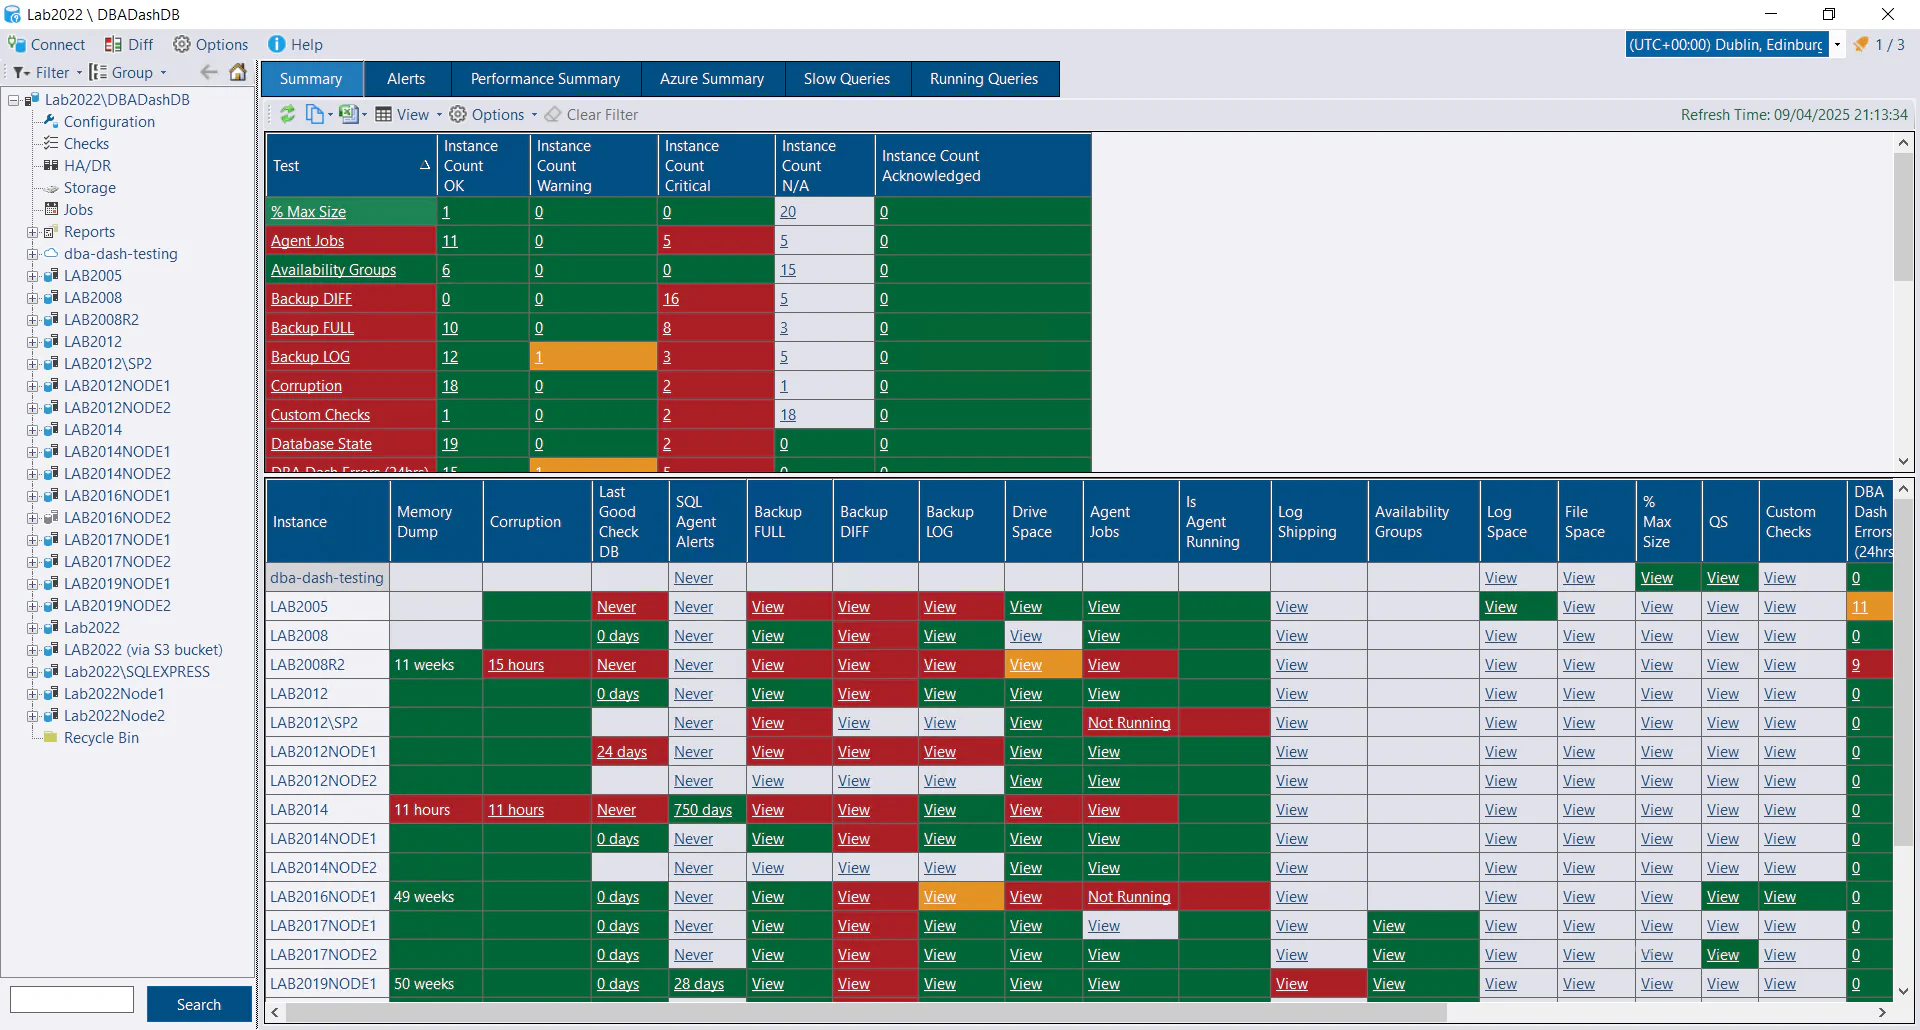 Check the health of all your SQL instances on a single dashboard. Backups, DBCC checks, Corruption, Agent Jobs, Log Shipping, AGs, database space, drive space, query store, database state, identity columns & custom checks.
⚠️This is a lab environment. Try to keep your production dashboard green. Fix issues and customize thresholds to meet the needs of your environment
Performance Summary
 Performance summary showing important metrics for all of your SQL instances on a single page. Customizable - add the metrics that are important to you.
Performance
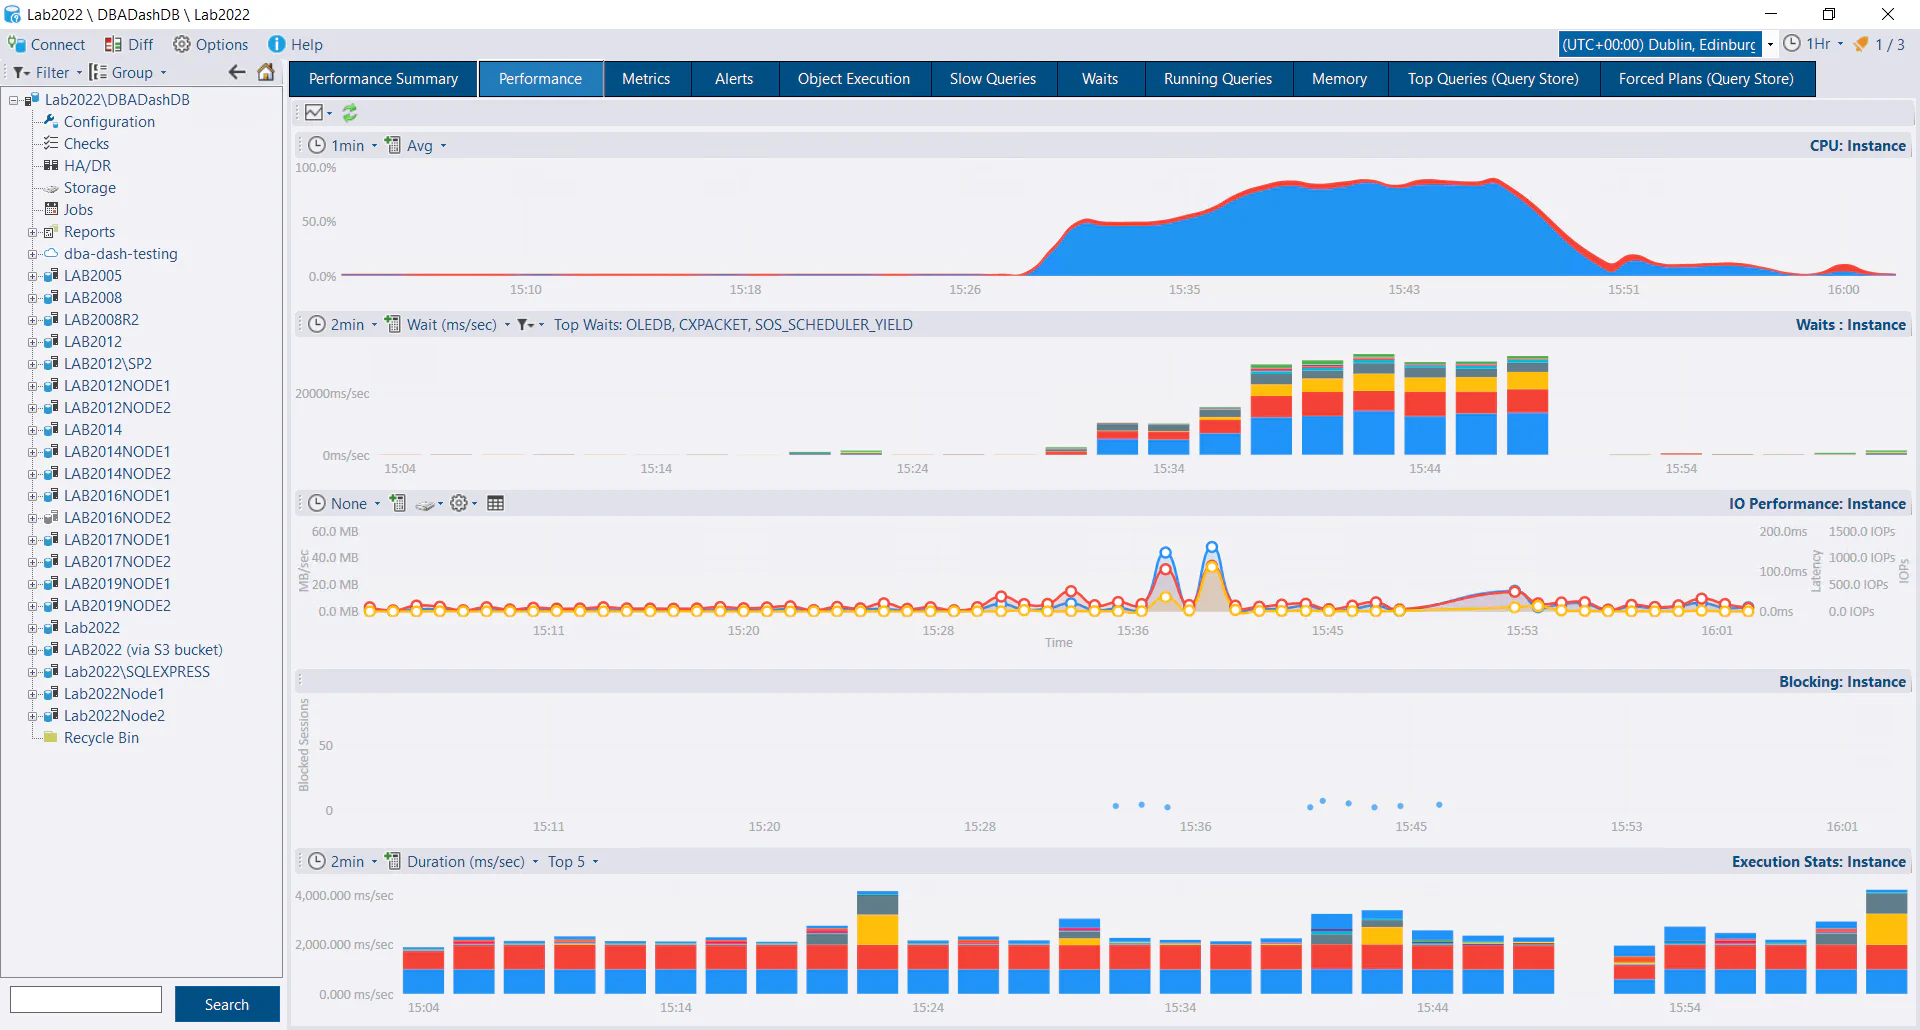 Drill down and see detailed performance metrics over time for a single instance. CPU chart, waits, IO, blocking & object execution stats.
Object Execution Stats
 Track the performance of your stored procedures over time. See which stored procedures are using the most CPU or IO, which are executed most frequently and which have the slowest execution times
Object Execution Compare
 See how your stored procedure performance compares to yesterday or last week. Identify regressions that might require attention and easily quantify the impact of performance optimizations.
Running Queries
 See what queries are running right now (or any point in time). See blocking chains and easily identify root blockers. View execution plans, query text (even capturing parameter values by linking DMV data with rpc/batch completed extended events). See wait resources, identify tempdb contention and more.
Running Queries Summary
 See a summary of captured running queries. Easily go back in time to see what was running at 5:24PM on Sunday
Memory
 See an internal view of where memory is being used on your SQL instance. Track memory usage associated with memory clerks over time. See memory related performance counters.
Slow Queries
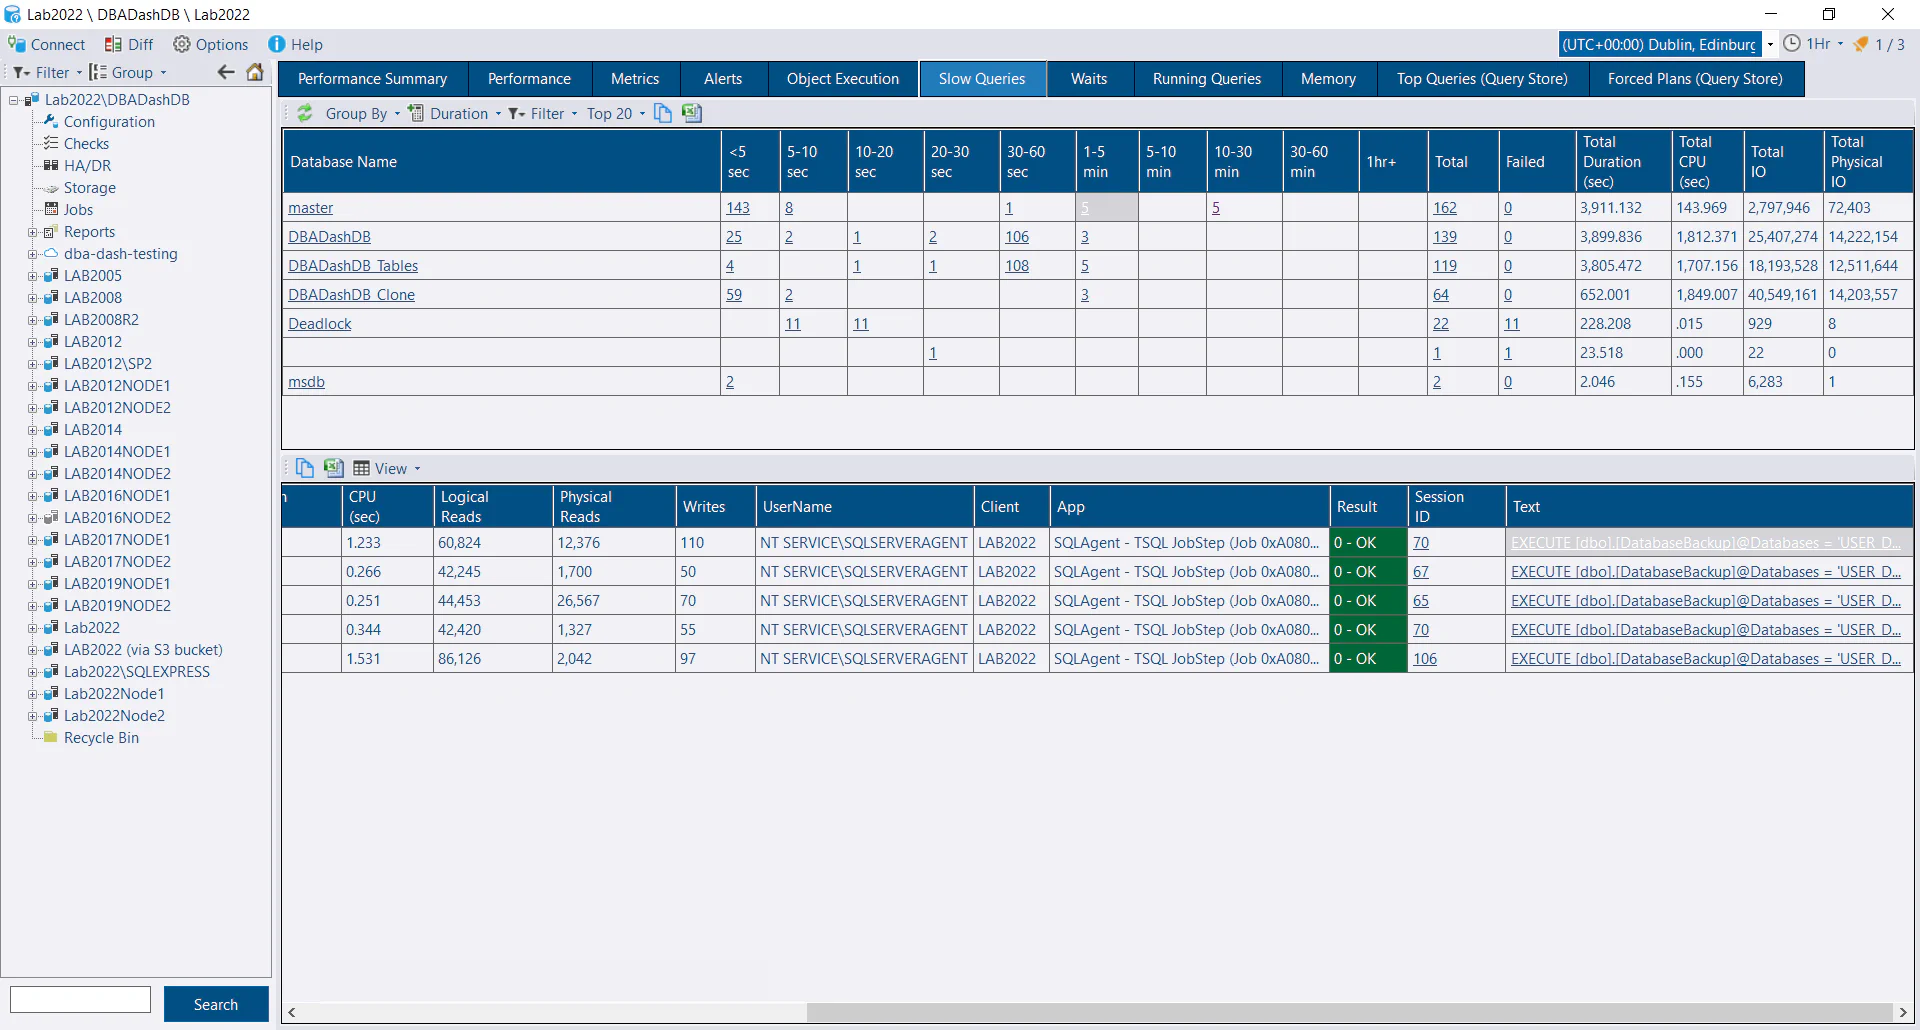 Slow queries captured using extended events (rpc/batch_completed events). Slice and dice by App, Database, Client, Object Name, Result & more. See the query text & parameters. Links to Running Queries data so you can see exactly what the query was doing at various points in it’s execution. Use this data to answer with confidence exactly why the query was slow. Was it blocked? Did it have a bad execution plan? Which statement was responsible?
Waits
 See which waits are most relevant for your SQL instance and track them over time. Is the SQL instance IO bound? Do we have blocking issues? Are we running out of worker threads? Are queries blocked waiting for memory grants? Waits are one of the most important tools to help diagnose performance issues
Metrics
 DBA Dash captures a variety of useful os performance counters. Custom metrics (SQL query or os performance counter) can also be added. Create custom dashboards.
Query Store
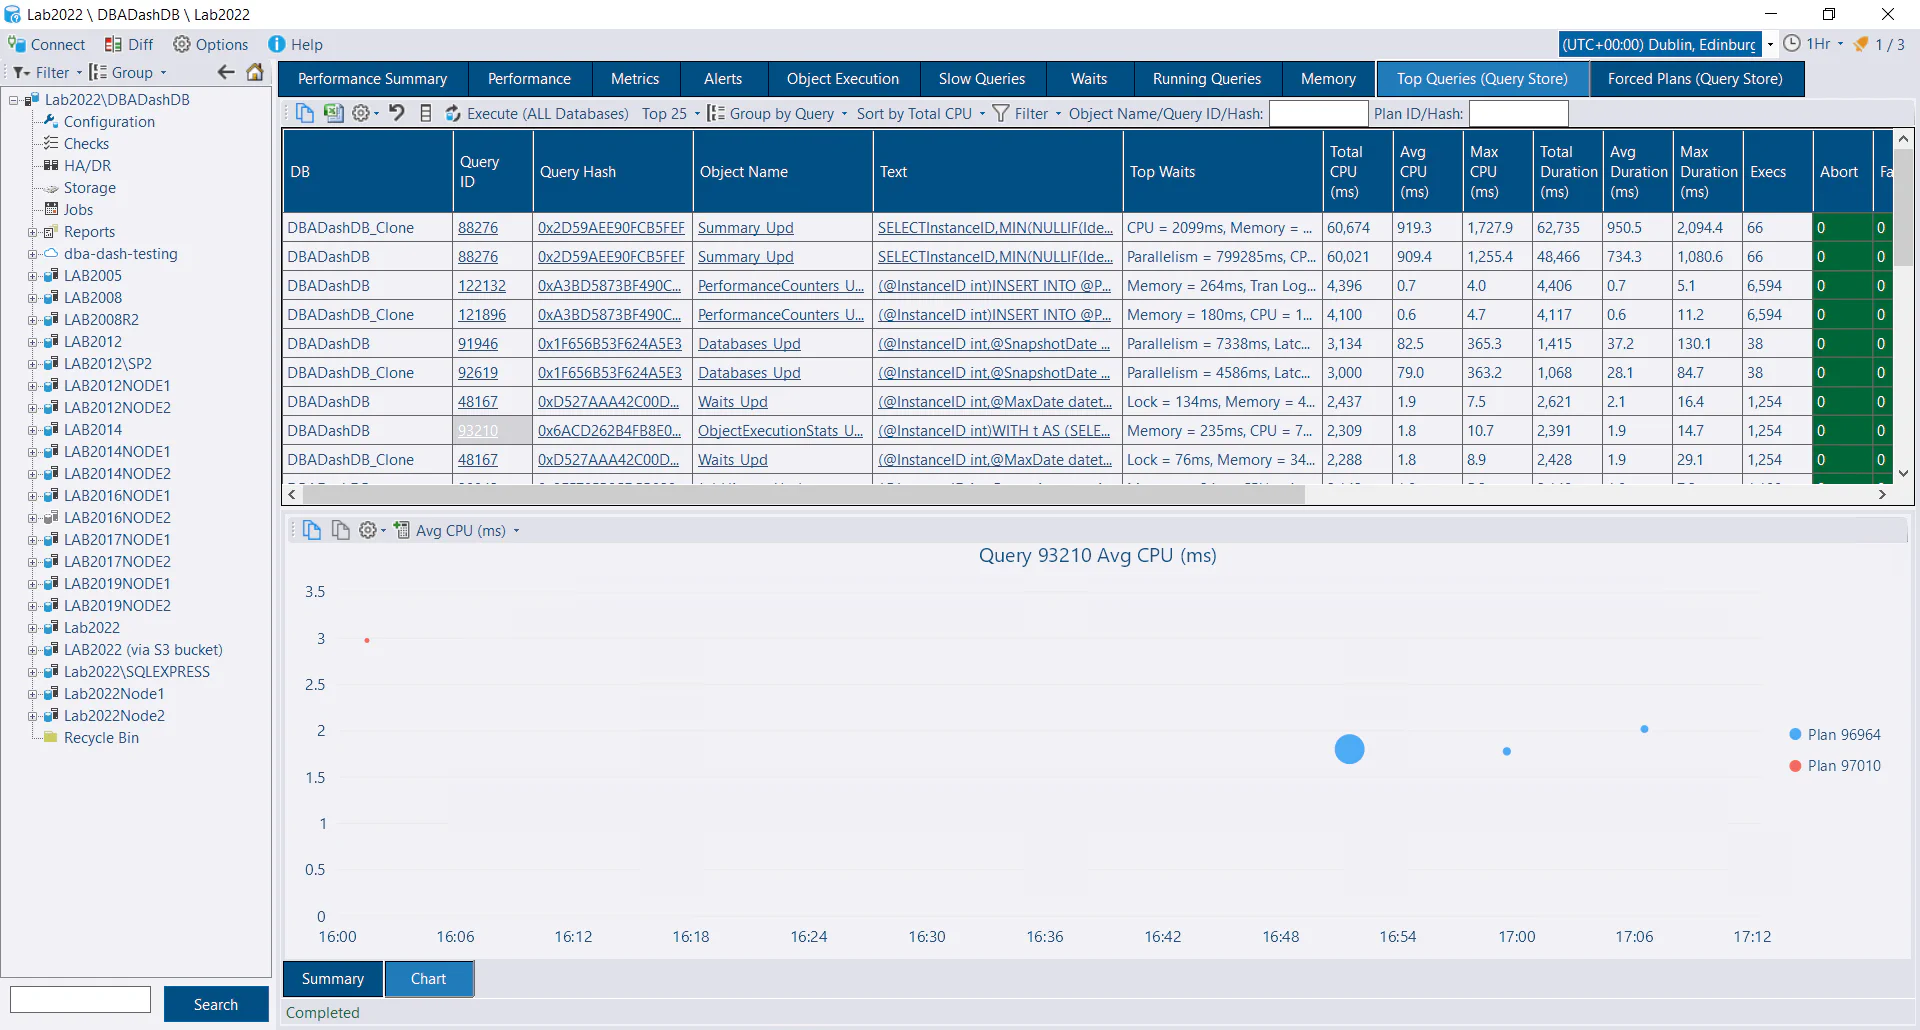 Use query store to find your most expensive queries by CPU, Duration, Execution Count, Memory Grant or IO. View query plans. Force/Unforce plans with logging.
Configuration
 Track sys.configurations settings across your SQL instance. Highlight best practices. Capture when settings have changed. Track various other configurations such as trace flags, hardware, drivers, tempdb config & many more
SQL Patching
 Compare your SQL instance patch levels with the latest available cumulative updates (Powered by dbatools build reference)
HA/DR monitoring
 Availability groups, Log Shipping, Mirroring & Backups
SQL Agent Jobs
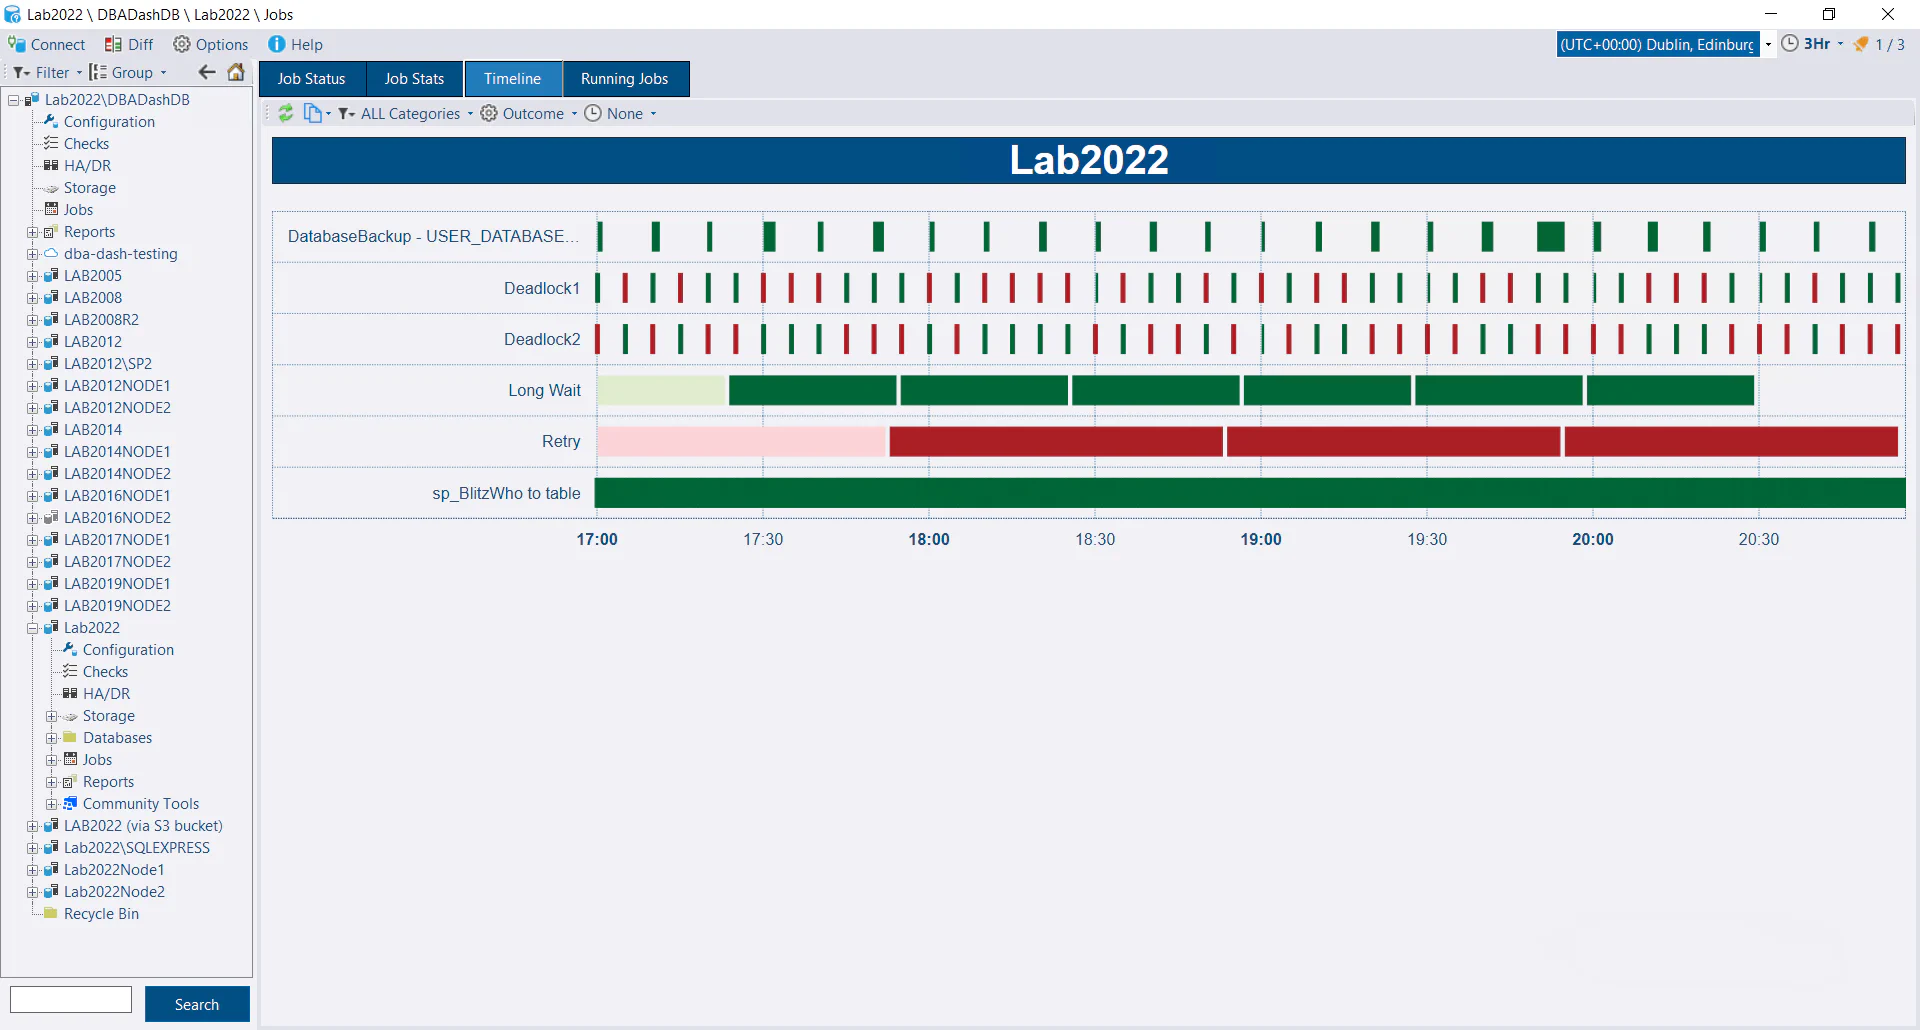
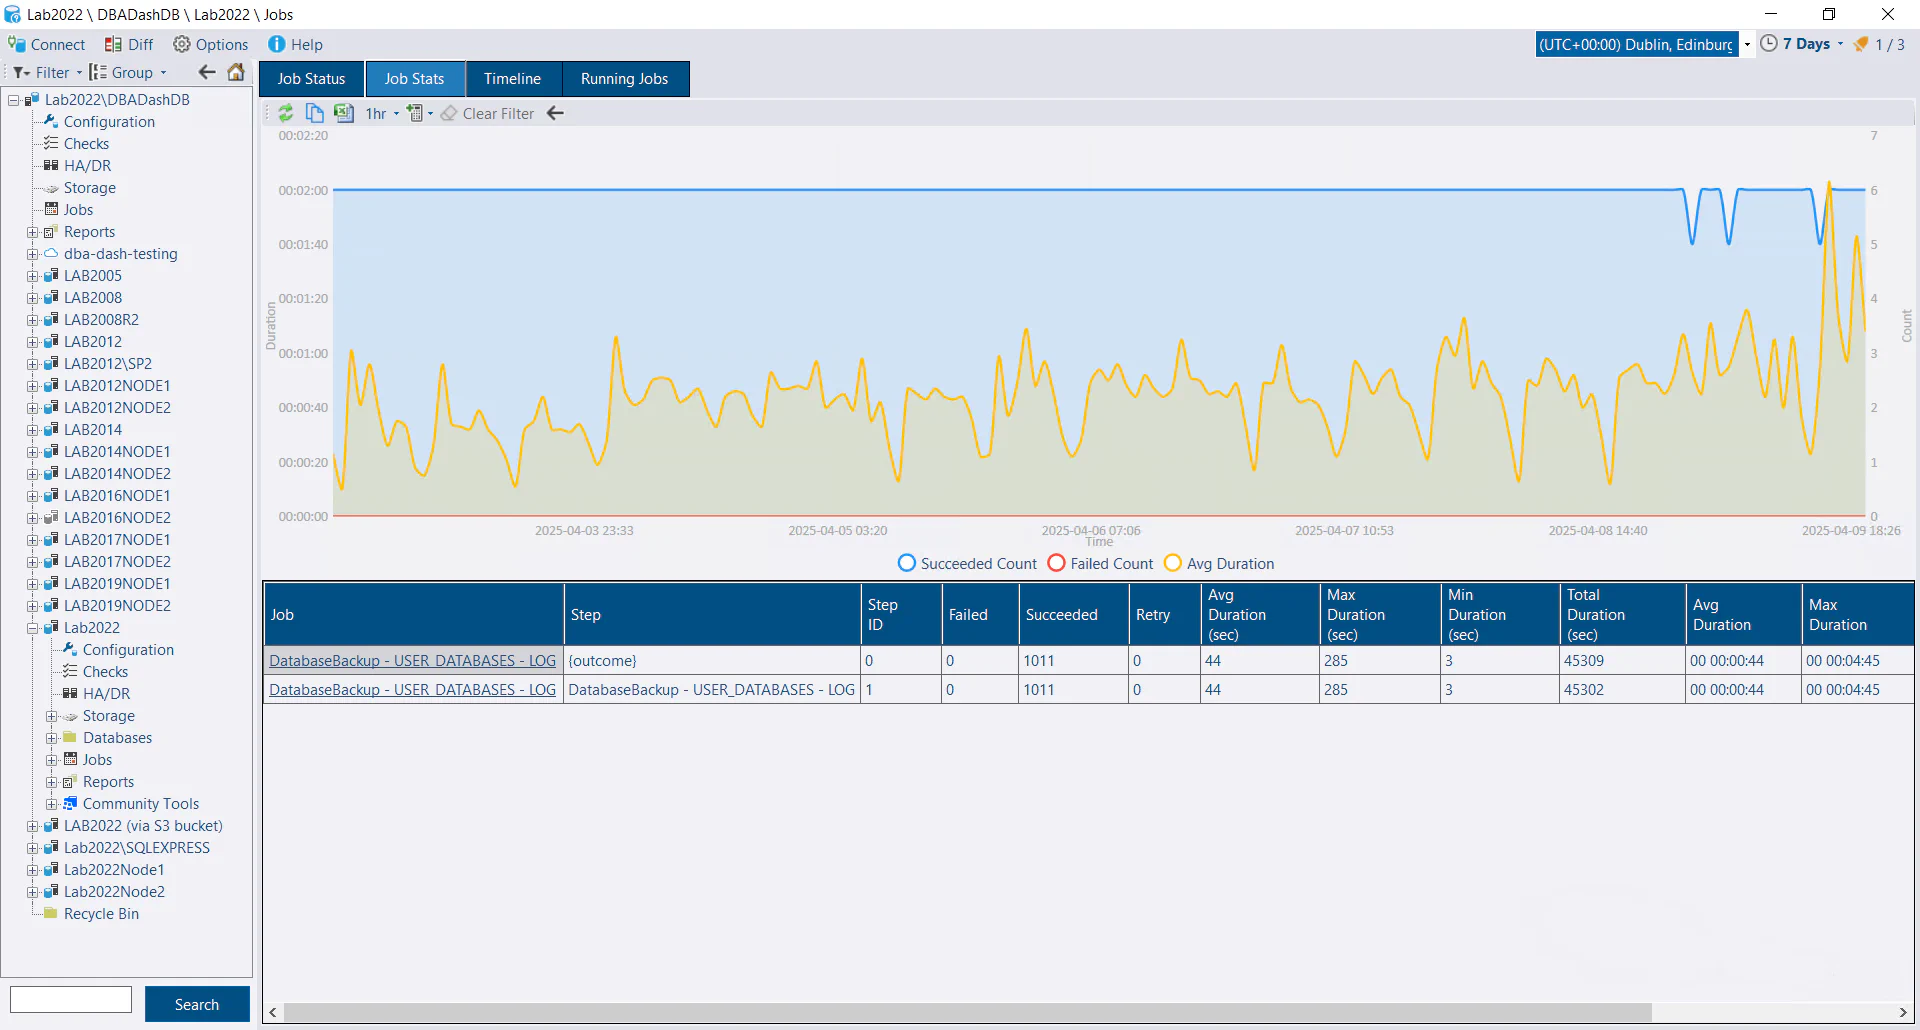 Track the performance of your SQL agent jobs over time, stored efficiently with long retention.
 Track DDL changes to your SQL agent jobs. Compare jobs across SQL instances.
Storage
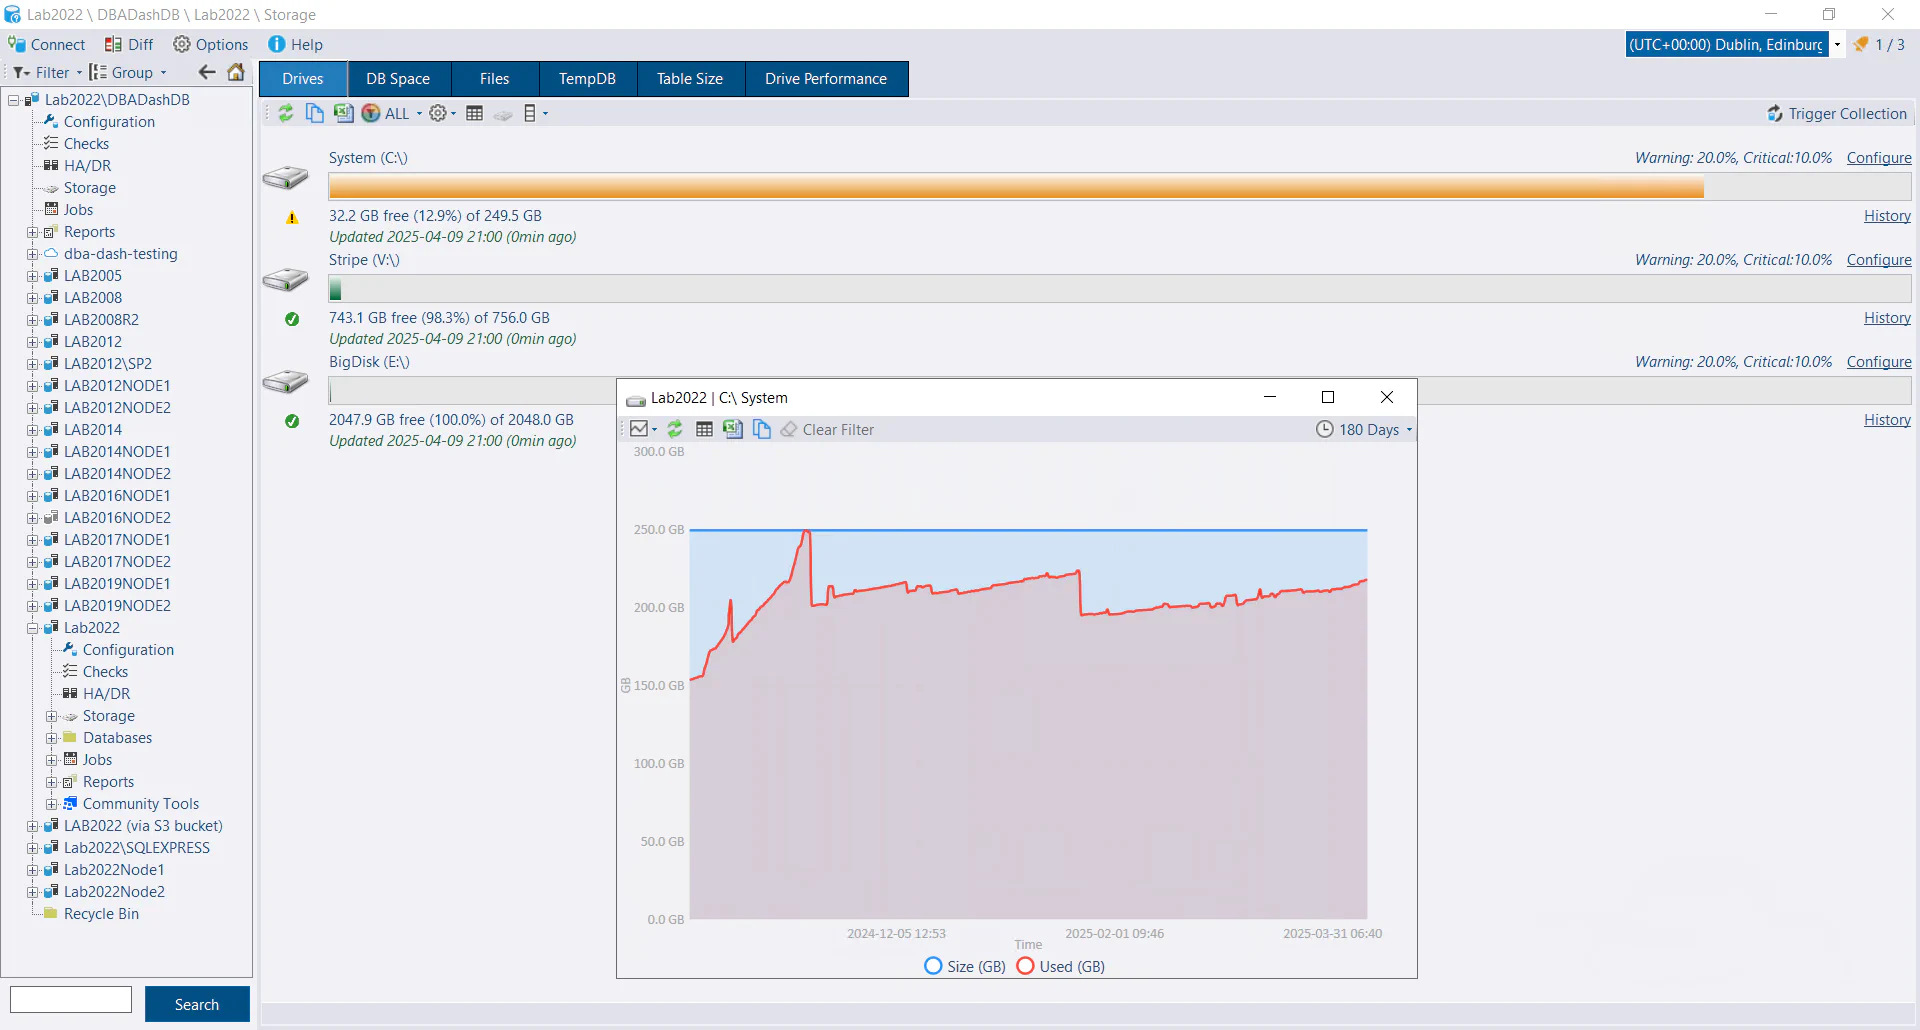 Track drive space across all your SQL instances & view space used over time for any drive
 Track the size of your databases across instances, databases or at file level
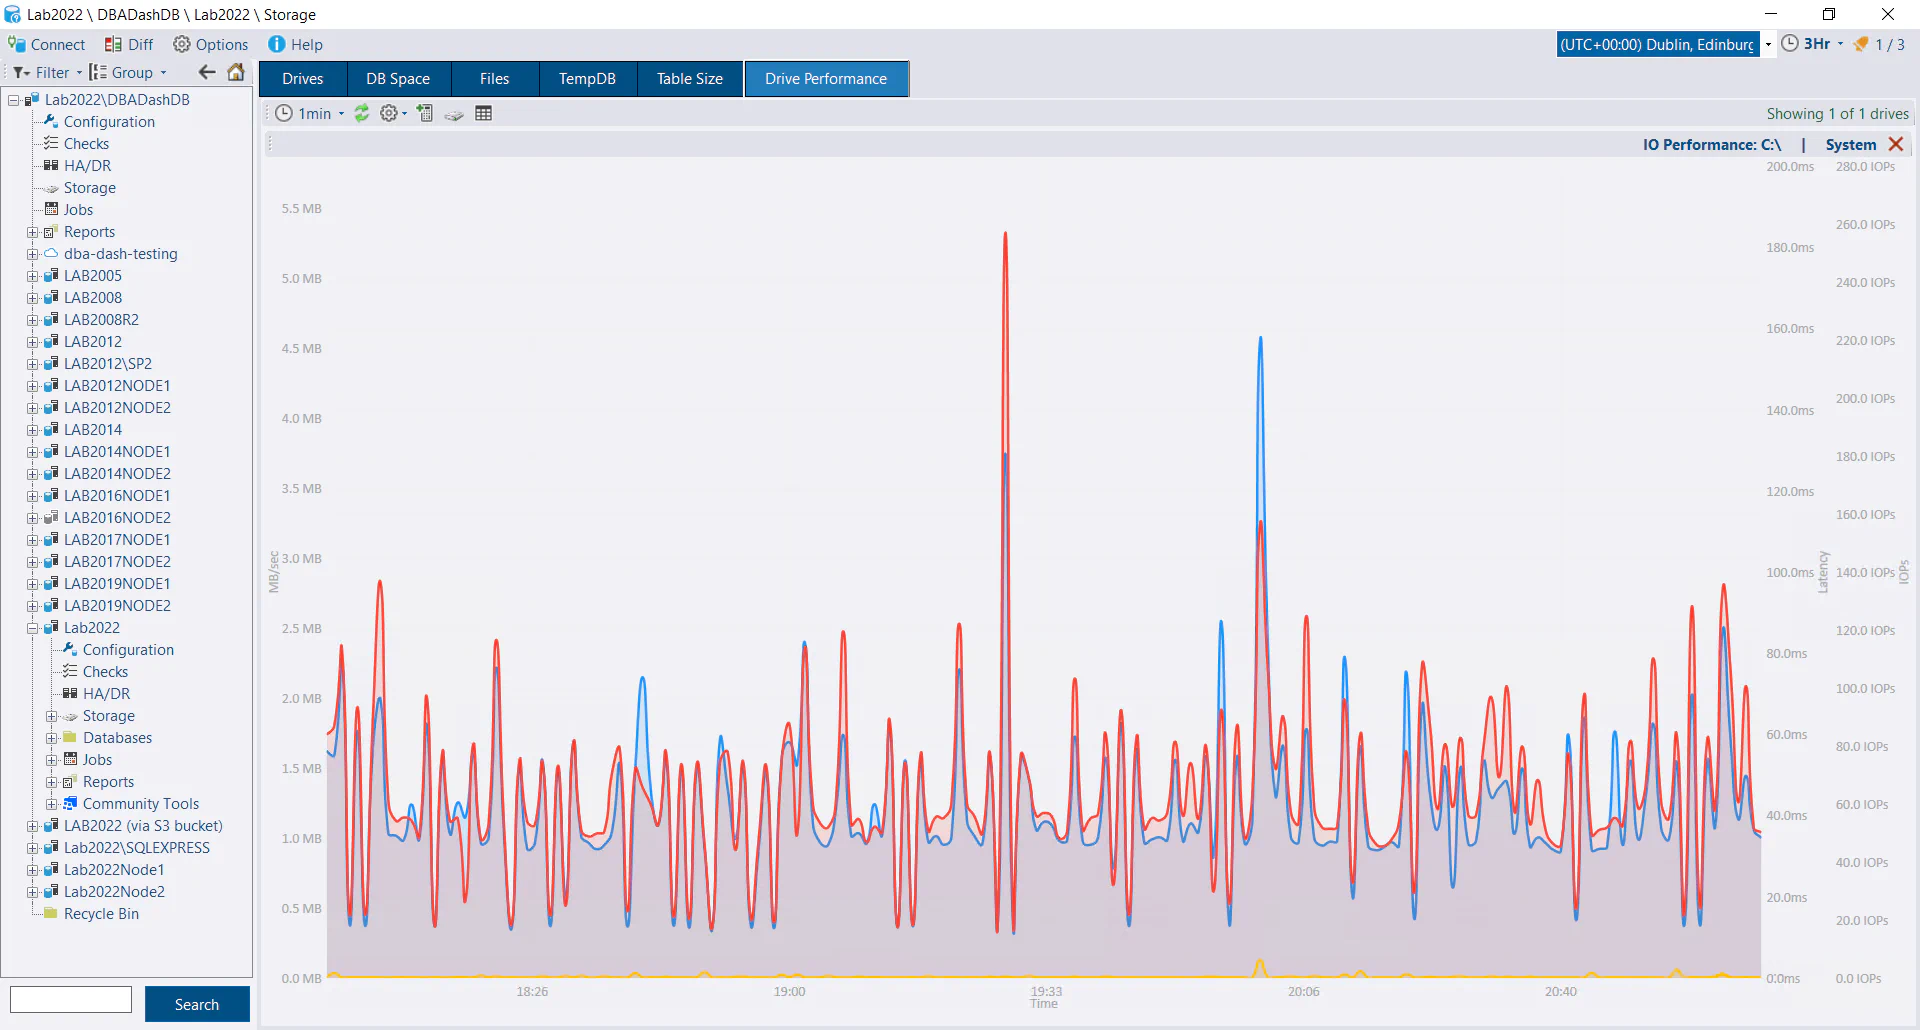 Monitor drive latency, throughput and IOPS
Community Tools
 Run community tools - sp_Blitz, sp_BlitzBackups, sp_BlitzCache…and many more
Schema Snapshots
 Database schema changes - what was changed when. See a history of schema changes for a stored procedure.
Custom Reports
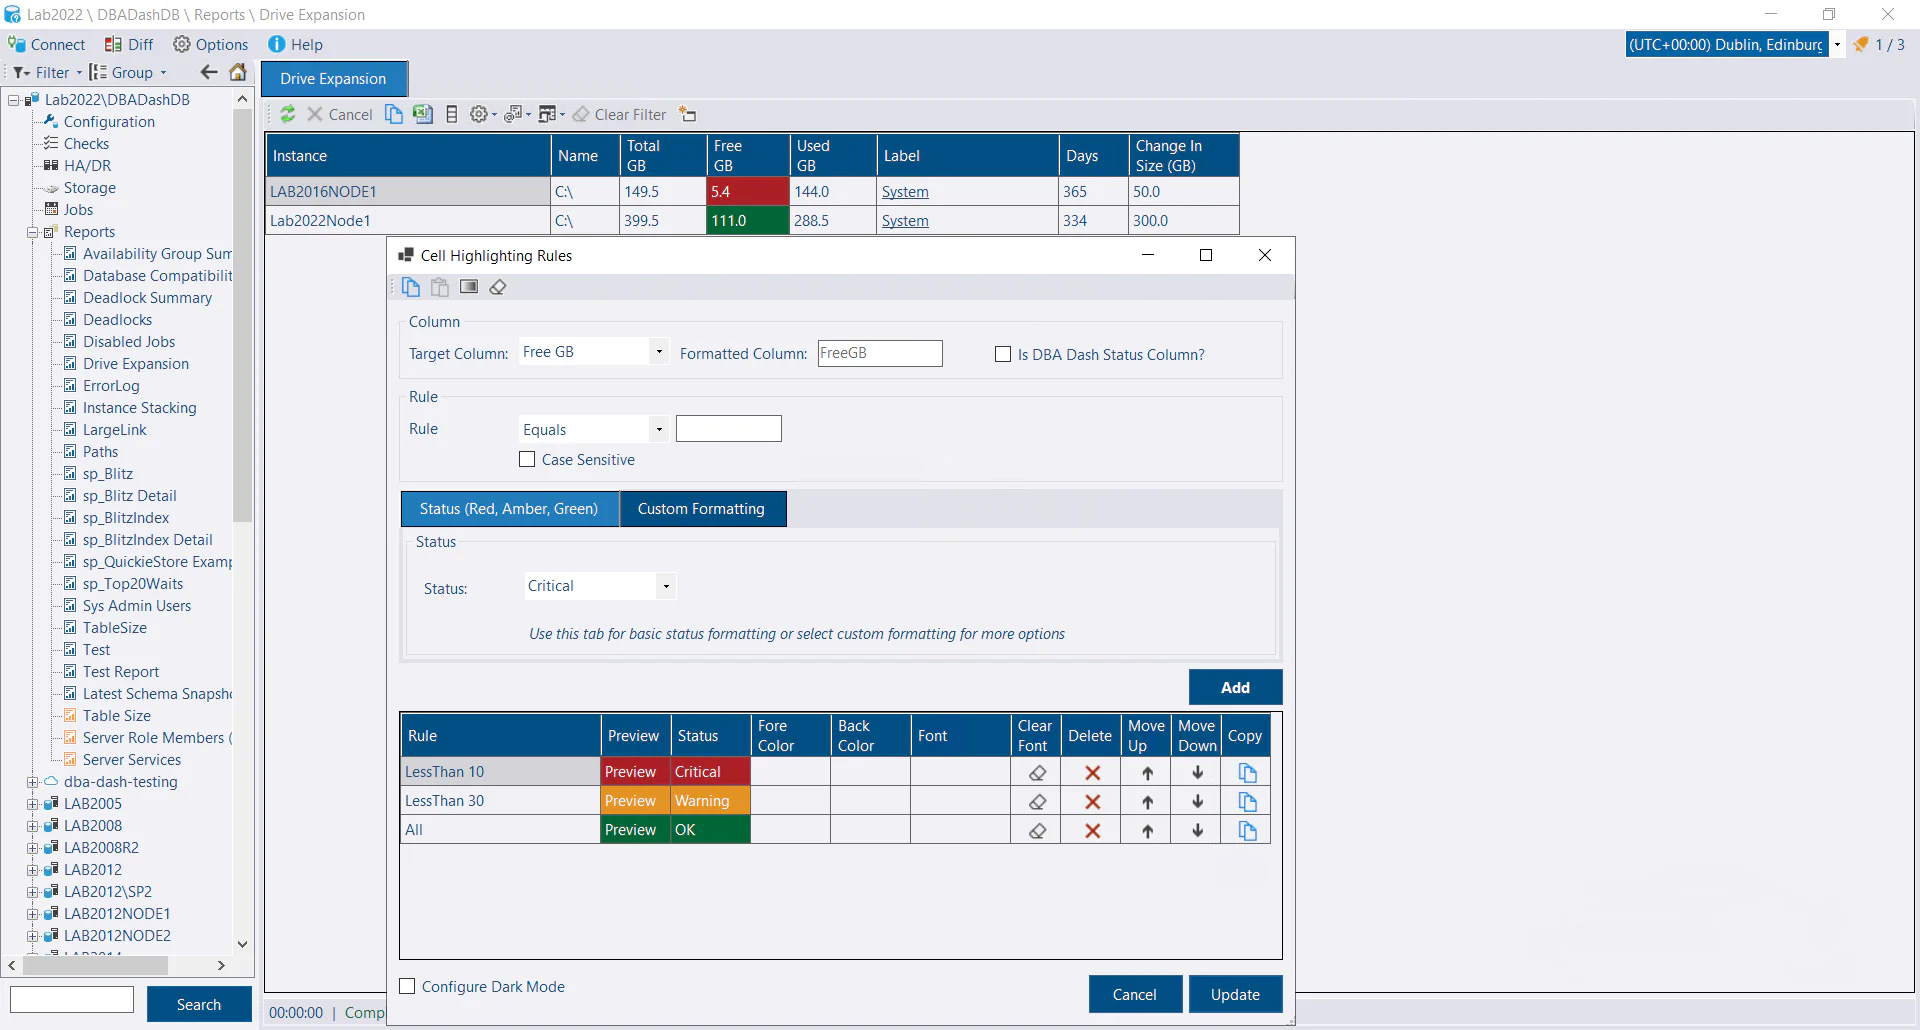 Your own custom reports which you can combine with custom collections
