Title here
Summary here
May 17, 2025 in Releases by David Wiseman3 minutes

SQL Agent Job Info tab, Running Queries link to Job info and Object Execution Stats...and more.
This new tab shows metadata about the job, steps and schedule when you click on a job in the tree.

Previously you could use the Job DDL tab to view the details of the job, but this can be hard for a human to parse. Having the schedule job steps and other metadata displayed in a friendly format is a big improvement.
I initially wanted to display schedule information, but the schedule information isn’t collected. Although I could create a new collection for this, I wondered if I could just parse this information with ScriptDom (which should be a reliable method to extract the data). I didn’t want to spend a lot of time on this so I got claude.ai to generate the code for me. It got me 95% of the way there which was great. I also tried Gemini which can be good, but failed on this occasion.
As the information is parsed from the script, it also allows me to display job info in a friendly format for previous versions. This also allows for a more friendly info page diff.

From the Running Queries tab, click the Job Name or Job ID columns to load information about the currently executing job. This provides access to the job metadata in addition to the execution history and past performance at the click of a button. You also get access to the change history.

Similar to the job link, you can now click the Object Name column to get execution stats associated with the stored procedure. You can see the past performance of a stored proc at the click of a button.

The query store Window can now have the time period set independently from the application global time.

You can use SET CONTEXT_INFO to associate binary data with the current session in your app. This is captured in DBA Dash on the Running Queries and Slow Queries tabs, shown as a hexadecimal string. There is now a context menu option to convert this into more meaningful data - a Guid, int or a string.

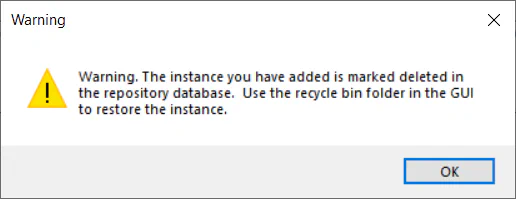
If an instance has been soft deleted, this can cause confusion if the instance is added back to the config. The collections will succeed, but the instance isn’t visible in the tree. Errors will now be logged if collections are running for an instance that has been soft deleted. Also, a warning message is now displayed when adding the connection back into the config.
The automatic service refresh can cause issues when the config tool has been running for a period of time. The refresh is now a bit smarter, reducing in frequency and turning off when the config tool is no longer in active use or the destination tab is not selected.
Thanks to Chad Baldwin for this contribution to improve wait resource parsing on SQL Server 2022.
See 3.23.0 release notes for a full list of fixes.